Northern
Key facts
Area covered by location1
Population of Queensland1
Other state-controlled road network
National Land Transport Network2
Program Highlights
Our top investments include:
- $280 million Townsville Ring Road (Stage 5) (jointly funded with the Australian Government)
- $109.5 million Townsville Northern Access Intersections Upgrade (jointly funded with the Australian Government)
- $96.9 million Burdekin River Bridge, rehabilitation program (jointly funded with the Australian Government)
- $96 million Townsville Connection Road (Stuart Drive), University Road to Bowen Road Bridge (Idalia), improve safety
- $95 million Garbutt - Upper Ross Road (Riverway Drive) Stage 2, Allambie Lane to Dunlop Street, duplicate to four lanes (jointly funded with the Australian Government)
- $70 million Townsville Connection Road (Stuart Drive), Bowen Road Bridge (Idalia), duplicate bridge and approaches
- $48 million Bruce Highway, Burdekin Deviation, plan and preserve corridor (jointly funded with the Australian Government)
- $48 million Bruce Highway, Ingham to Cardwell Range Deviation, plan and preserve corridor (jointly funded with the Australian Government)
- $43.2 million Garbutt - Upper Ross Road, Halliday Street to Gouldian Avenue, improve safety
- $19.3 million Ross River Road, Mabin Street to Rolfe Street, improve safety
Investments (interactive)
You can view the list of investments for the Northern area via the QTRIP interactive tool or in the QTRIP PDF.
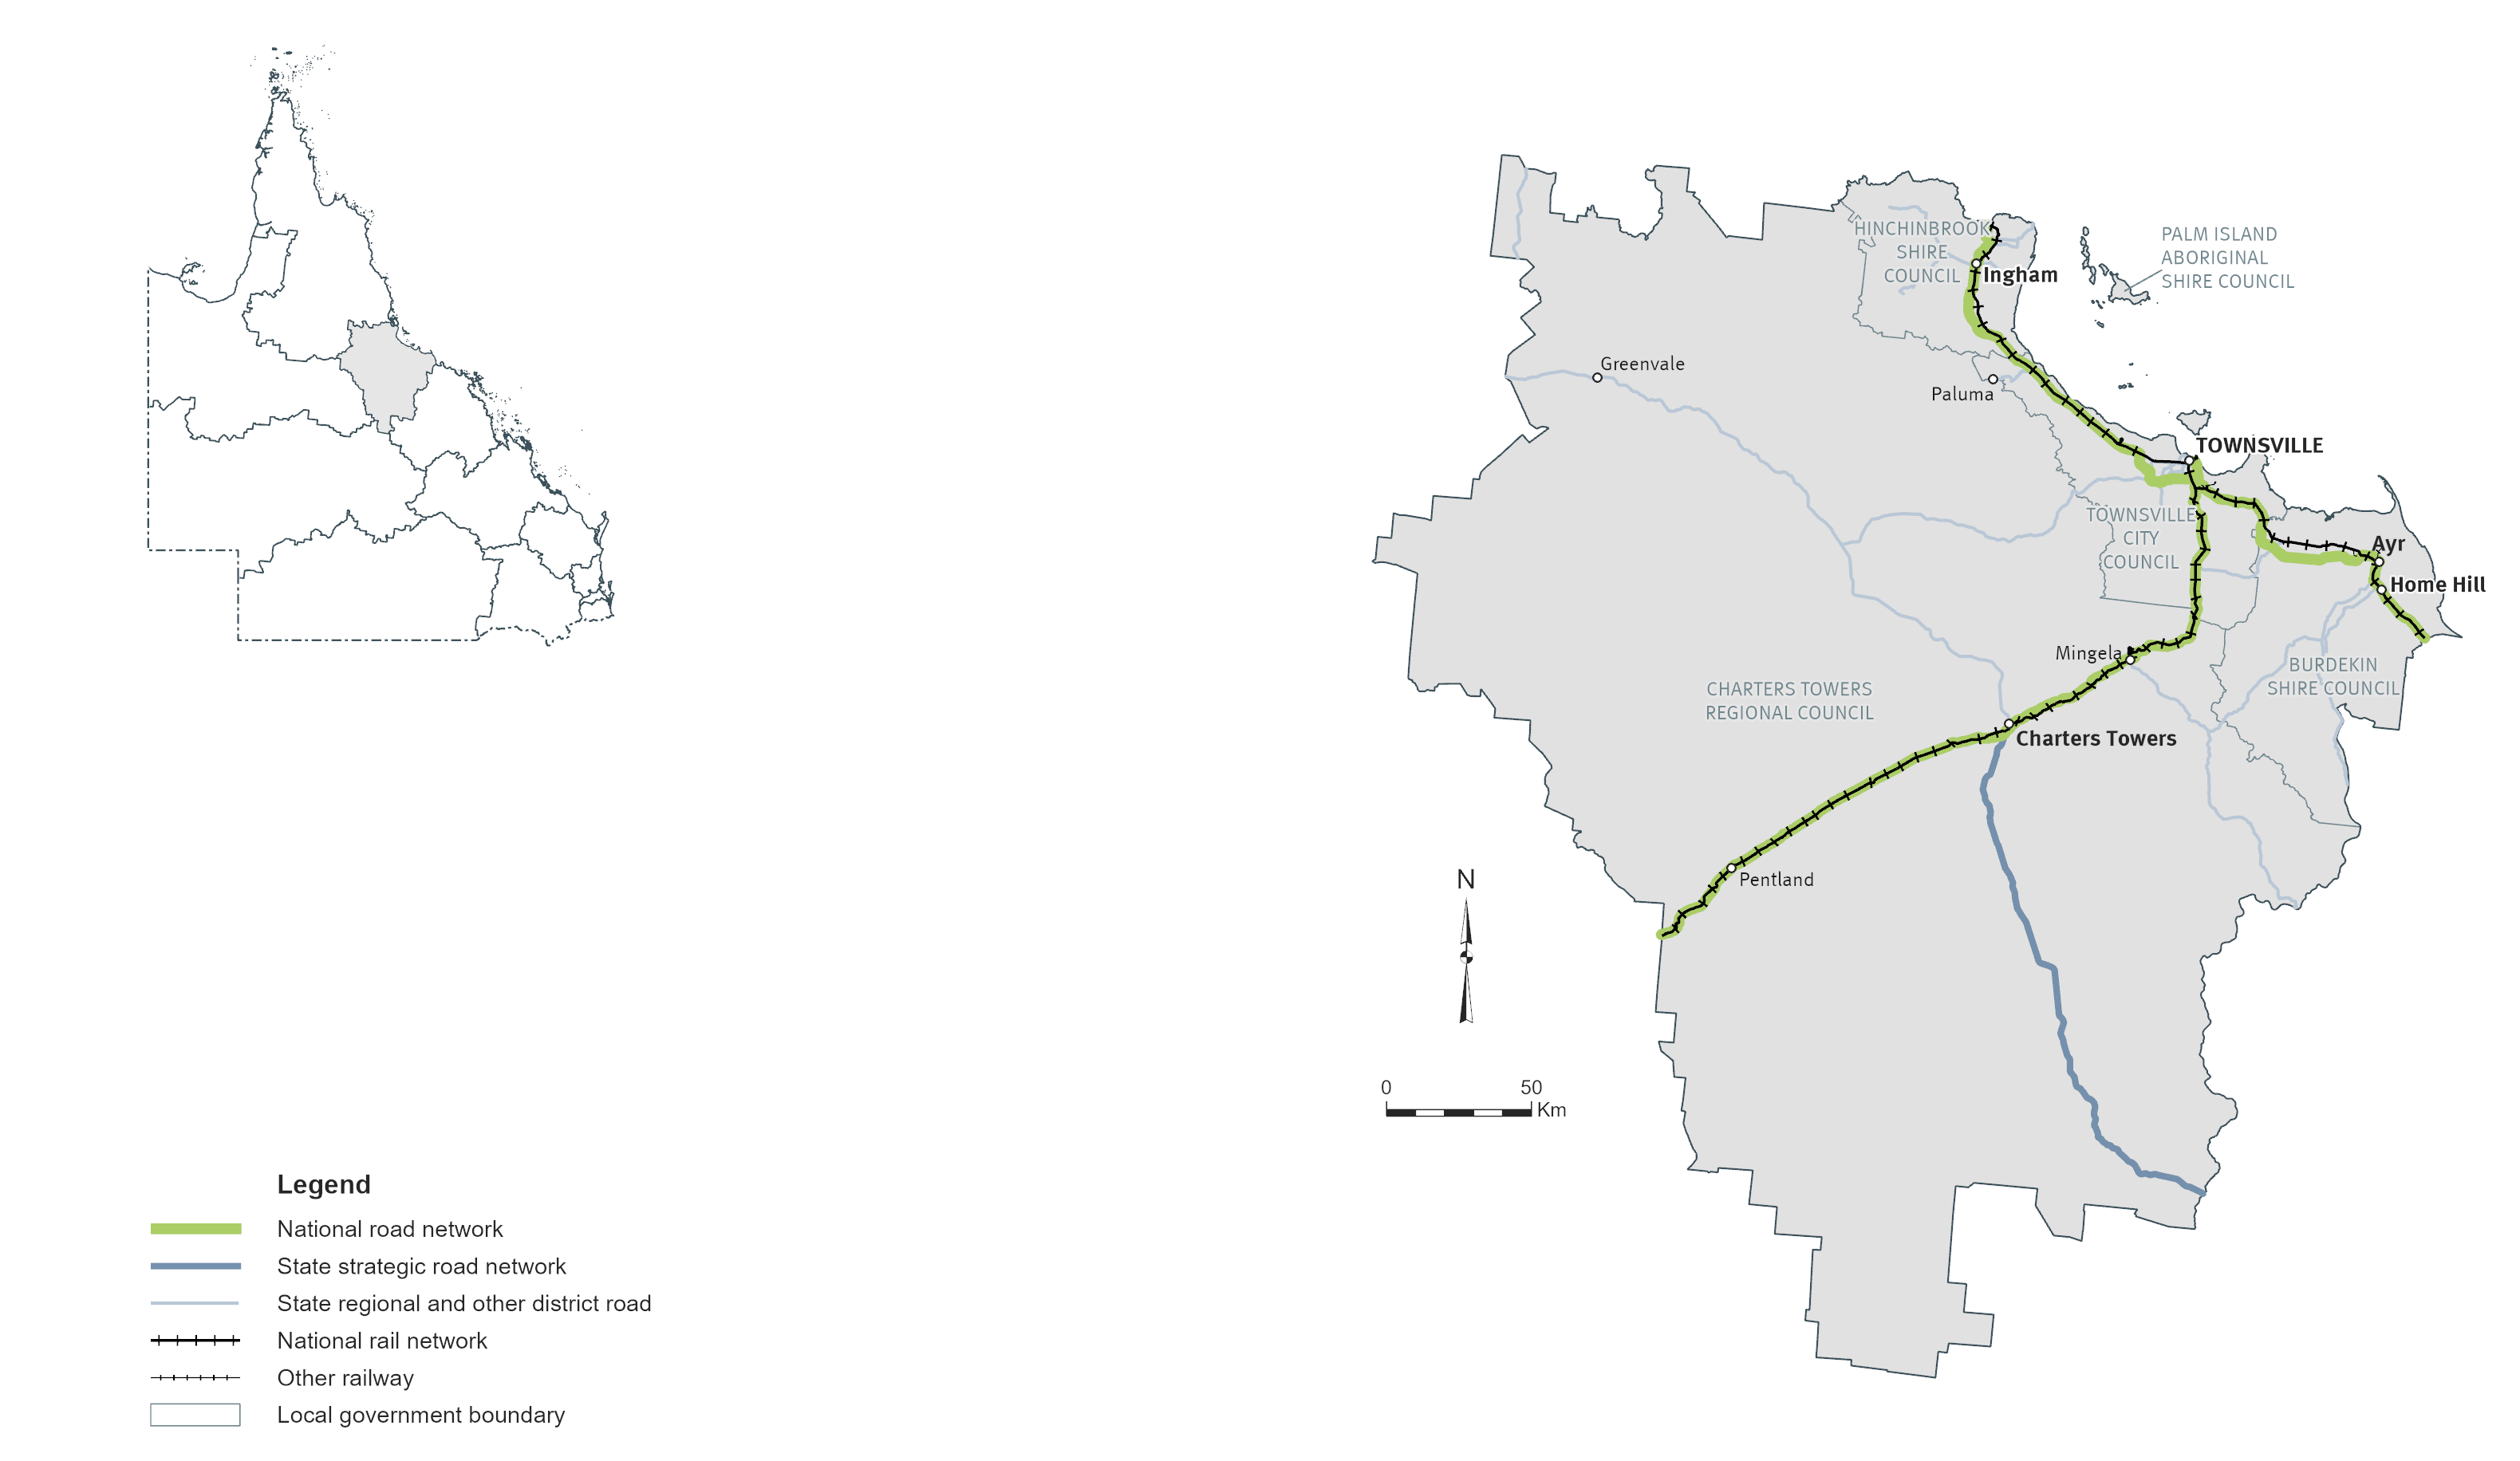
Map