
Multimedia walking content
Infographics
We encourage you to share these infographics on social media and your own websites. This selection of infographics is taken from the Queensland Walking Strategy 2019–2029 and the Walking in Queensland Report 2019.
When using these infographics please credit Department of Transport and Main Roads, Queensland Walking Strategy and link to www.tmr.qld.gov.au/walking.
Queensland Walking Strategy infographics
Access for all
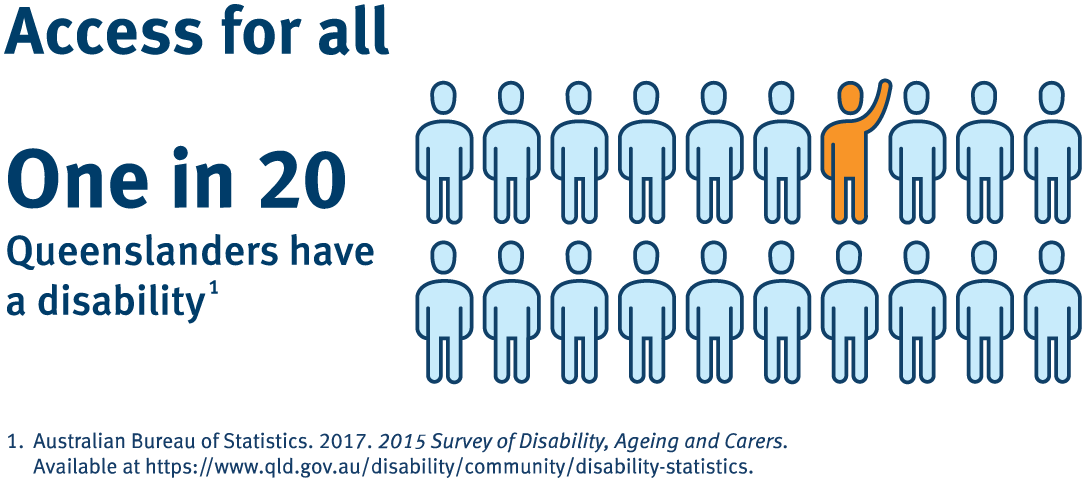
One in 20 Queenslanders have a disability.
Benefits of walking
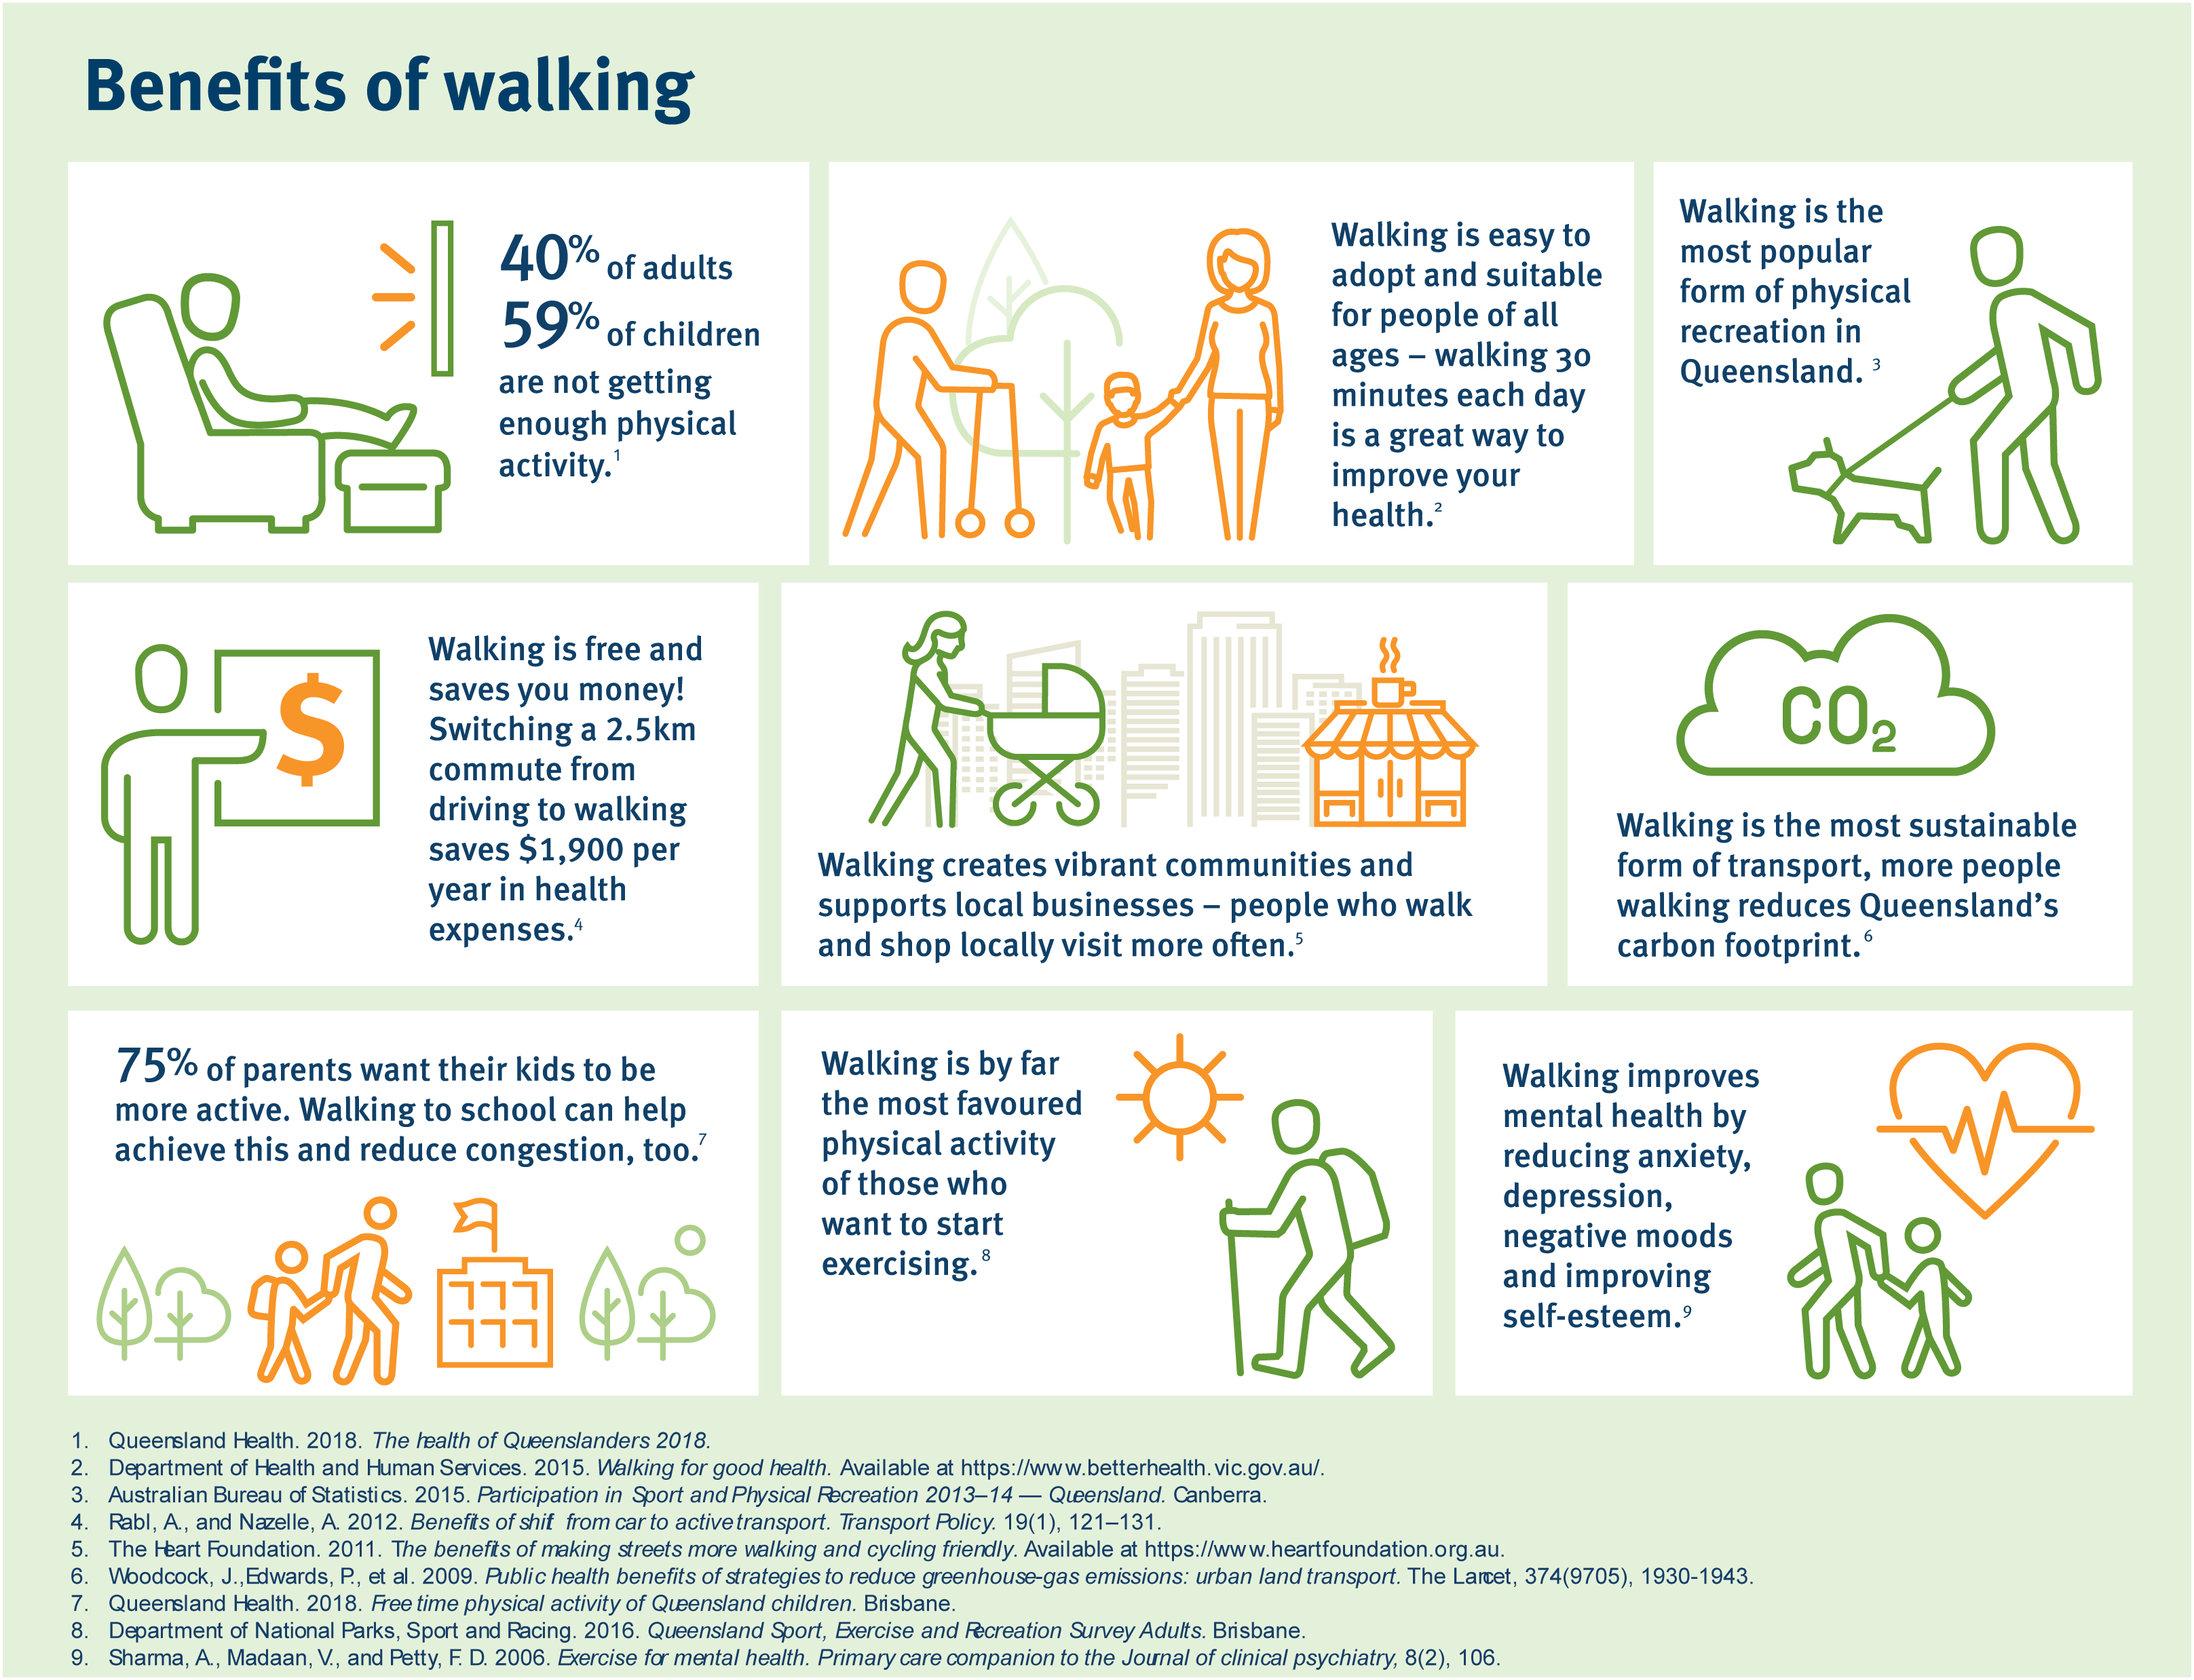
This infographic lists a number of walking benefits.
- PNG version of the Benefits of walking infographic
- SVG version of the Benefits of walking infographic
Monetary benefits of walking
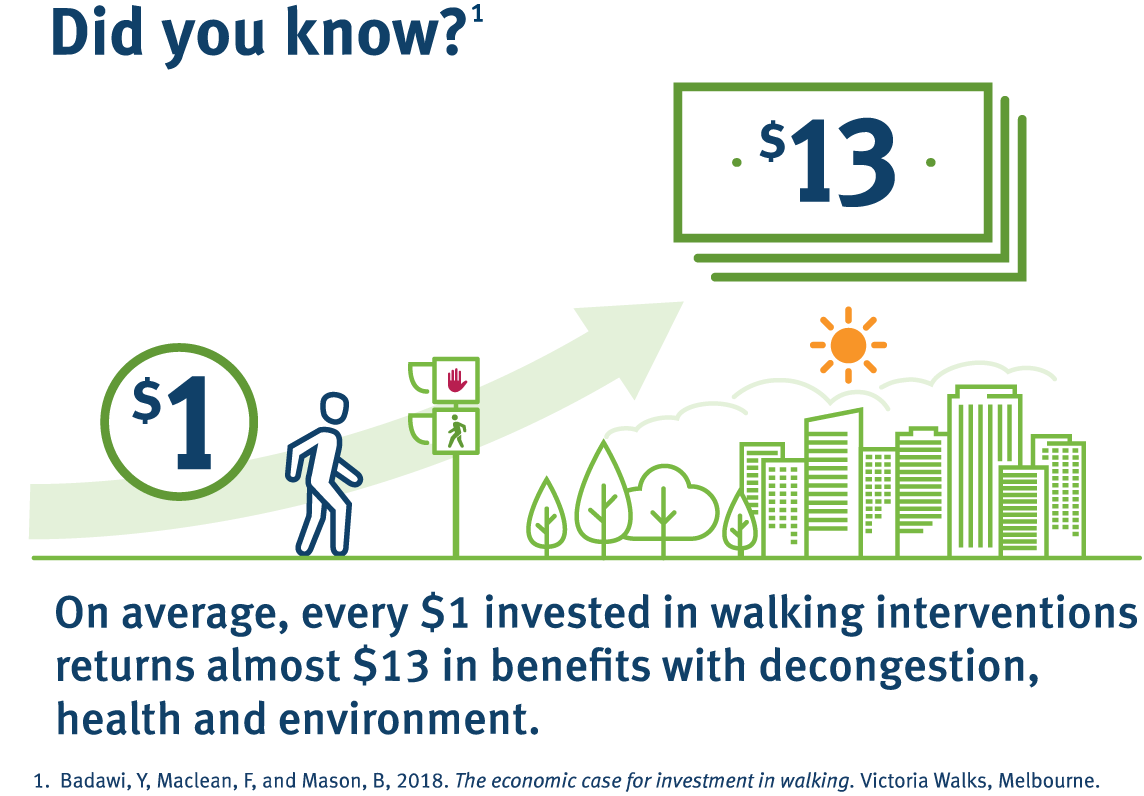
On average, every $1 in walking interventions returns almost $13 in benefits with decongestion, health and environment.
- PNG version of the Monetary benefits of walking infographic
- SVG version of the Monetary benefits of walking infographic
Queenslanders over 65
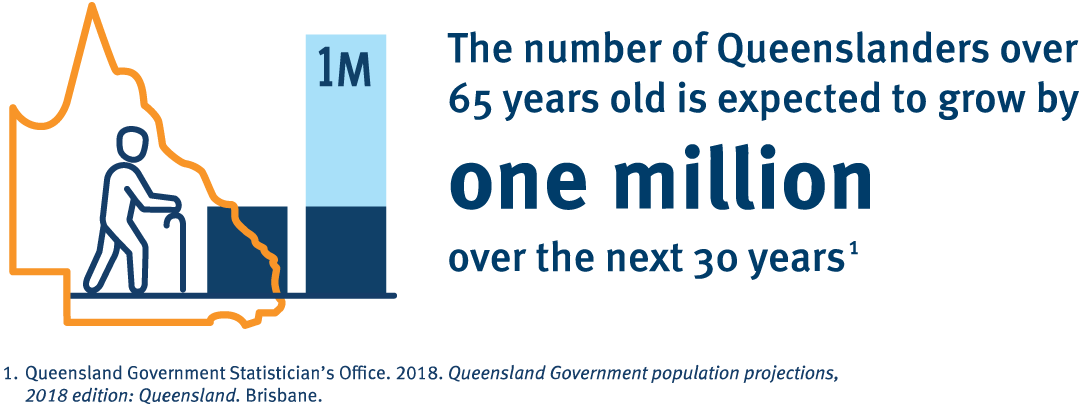
The number of Queenslanders over 65 years old is expected to grow by 1 million over the next 30 years.
- PNG version of the Queenslanders over 65 infographic
- SVG version of the Queenslanders over 65 infographic
Sustainable transport hierarchy
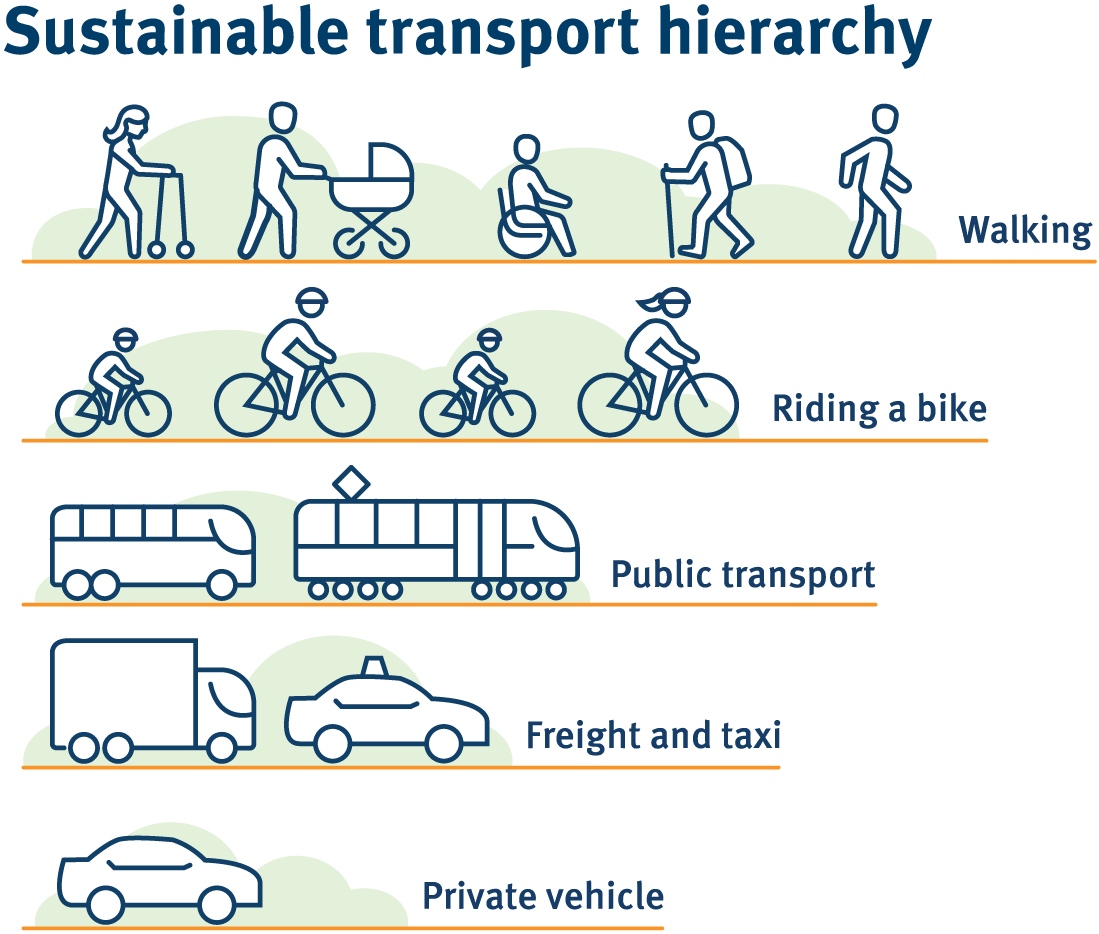
This infographic shows the hierarchy of sustainable transport options. From most to least sustainable:
- walking
- riding a bike
- public transport
- freight and taxi
- private vehicle.
- PNG version of the Sustainable transport hierarchy infographic
- SVG version of the Sustainable transport hierarchy infographic
Encouraging Queenslanders to walk more
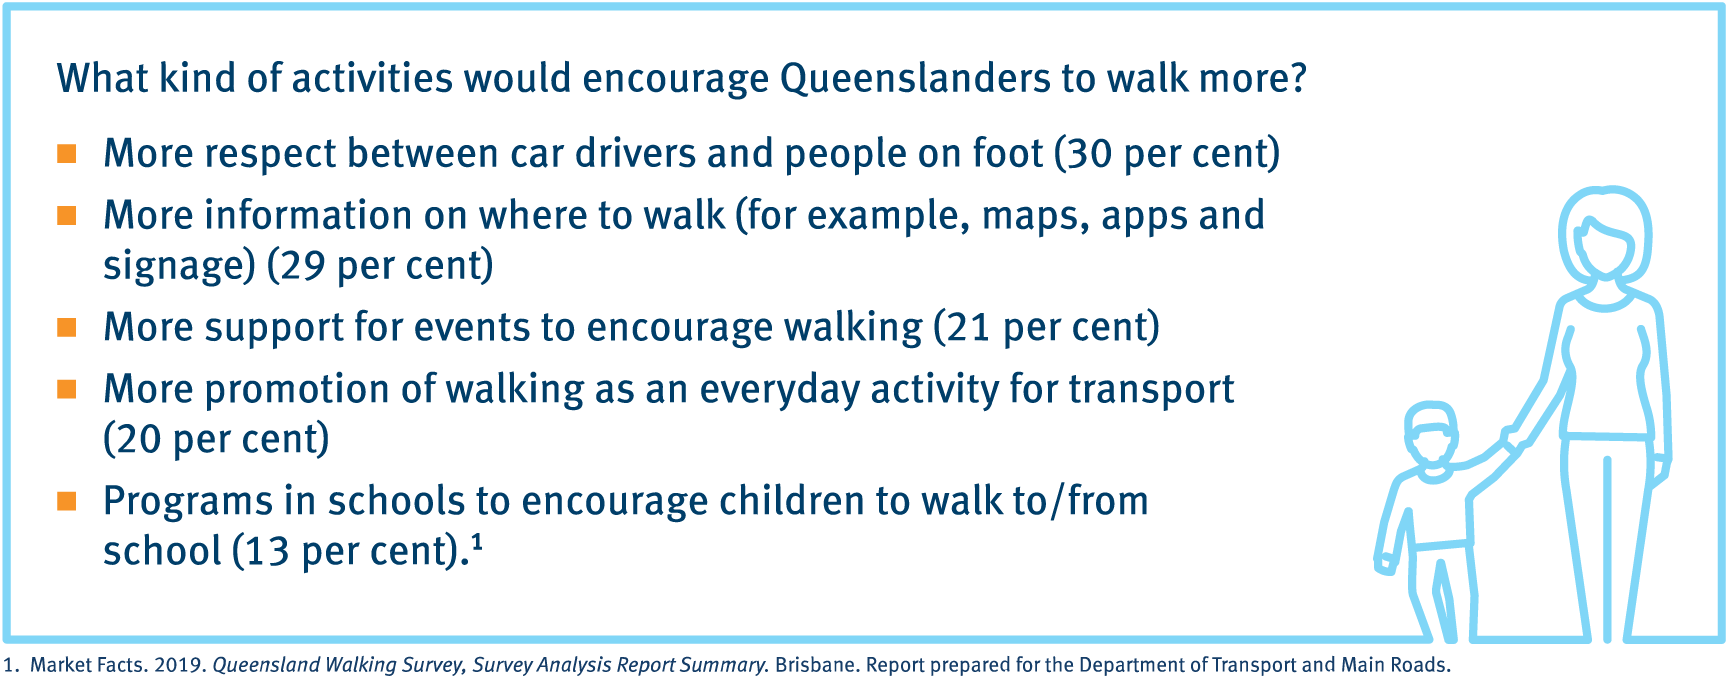
Queenslanders would be encouraged to walk more by:
- more respect between car drivers and people on foot
- more information on where to walk (maps, apps and signage)
- more support for events to encourage walking
- more promotion of walking as an everyday activity for transport
- programs in schools to encourage children to walk to/from school
- PNG version of the Encouraging Queenslanders to walk more infographic
- SVG version of the Encouraging Queenslanders to walk more infographic
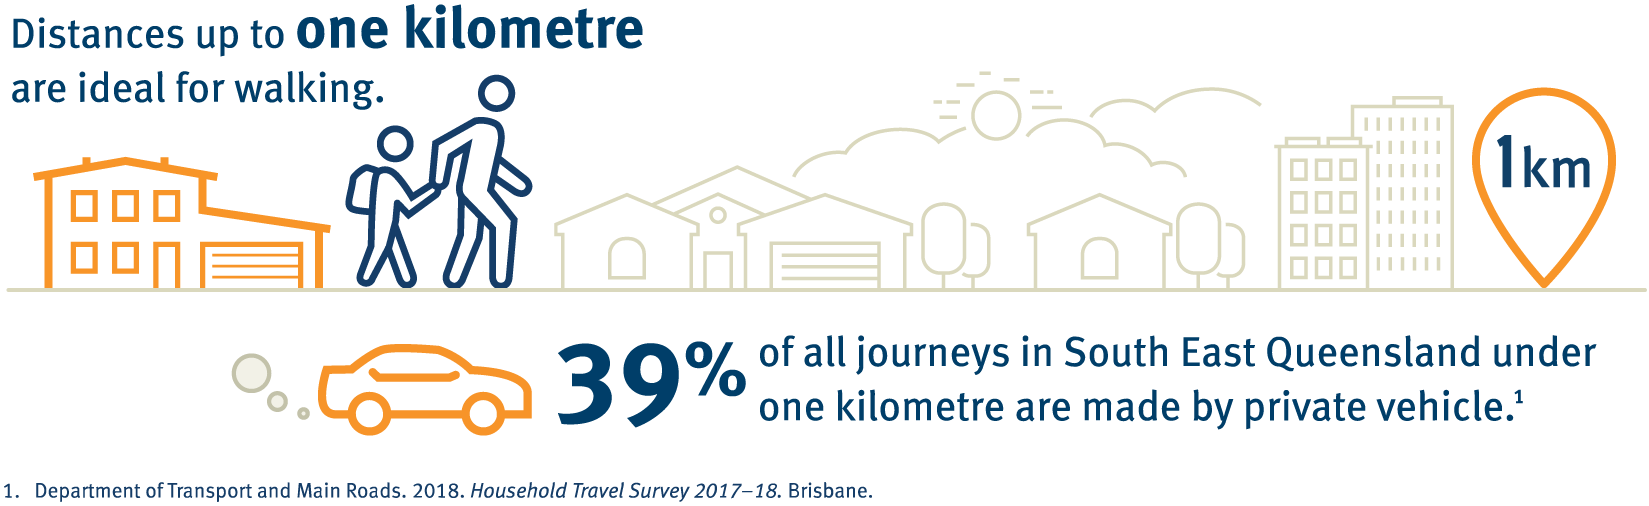
Distances up to 1km
Distances up to 1km are ideal for walking. 39% of all journeys in South East Queensland under 1km are made by private vehicle.
- PNG version of the Distances up to 1km infographic
- SVG version of the Distances up to 1km infographic
Walking in Queensland infographics
Walking benefits our economy
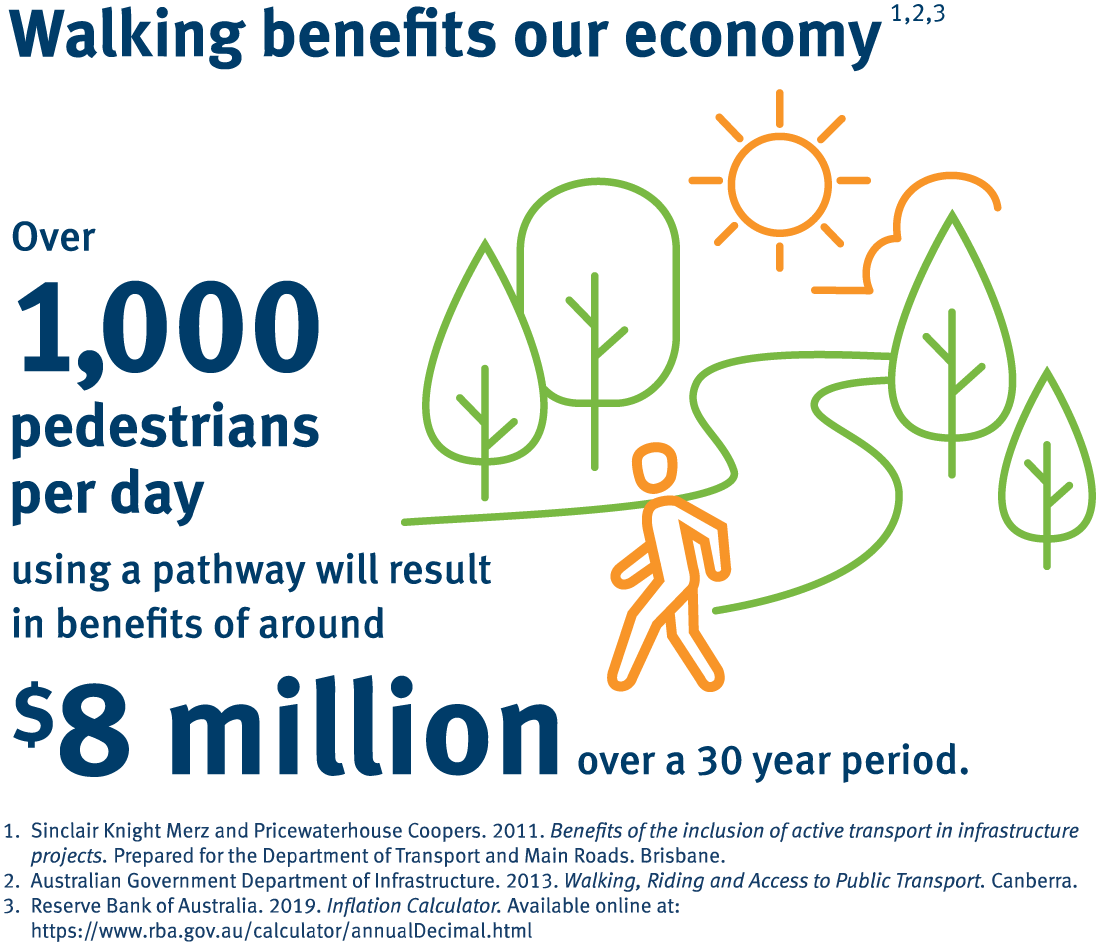
Over 1000 pedestrians per day using a pathway will result in benefits of around $8 million over a 30 year period.
- PNG version of the Walking benefits our economy infographic
- SVG version of the Walking benefits our economy infographic
Cost-benefit ratios for selected infrastructure projects
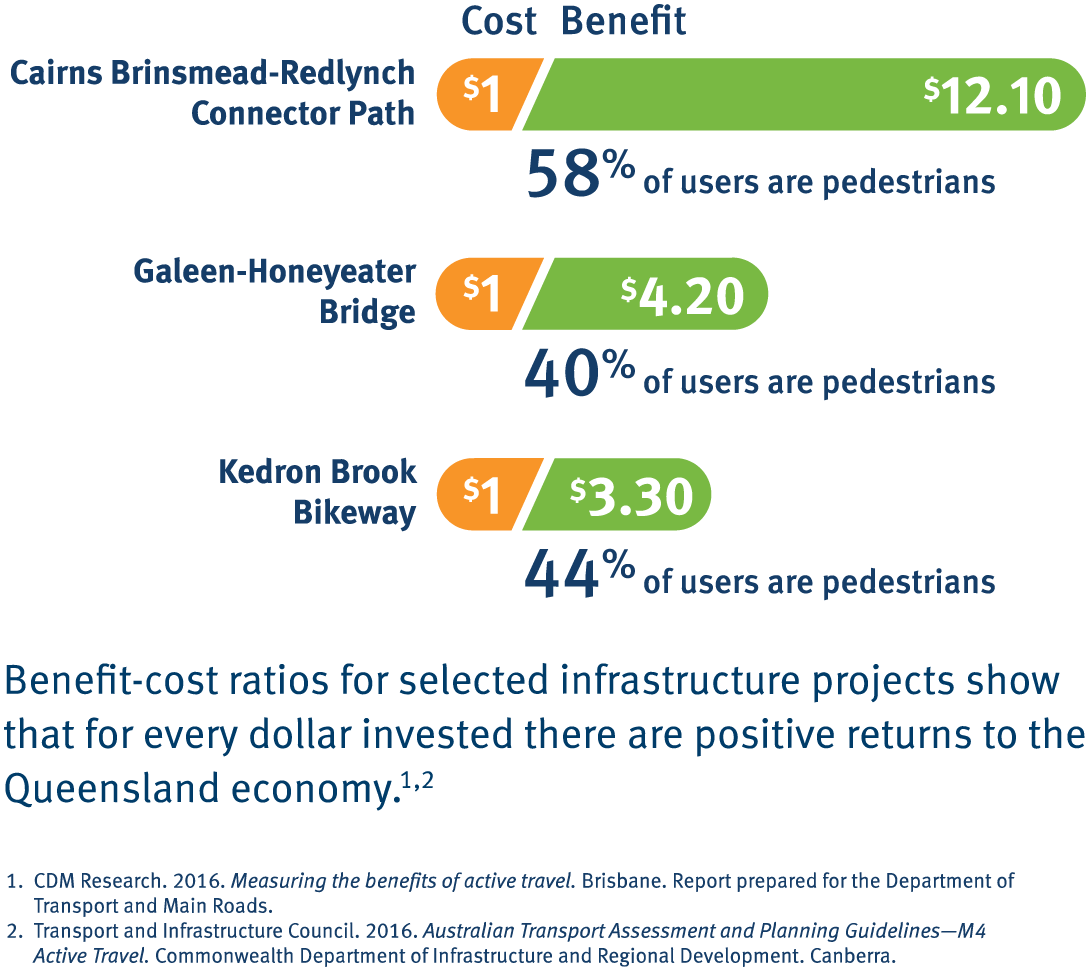
- The Cairns Brinsmead-Redlynch Connector Path has a benefit of $12.10 for every dollar spent, and 58% of the users are pedestrians
- The Galeen-Honeyeater Bridge has a benefit of $4.20 for every dollar spent, and 40% of users are pedestrians
- The Kedron Brook Bikeway has a benefit of $3.30 for every dollar spent, and 44% of users are pedestrians.
- PNG version of the Cost-benefit ratios for selected infrastructure projects infographic
- SVG version of the Cost-benefit ratios for selected infrastructure projects infographic
Pedestrian road fatalities
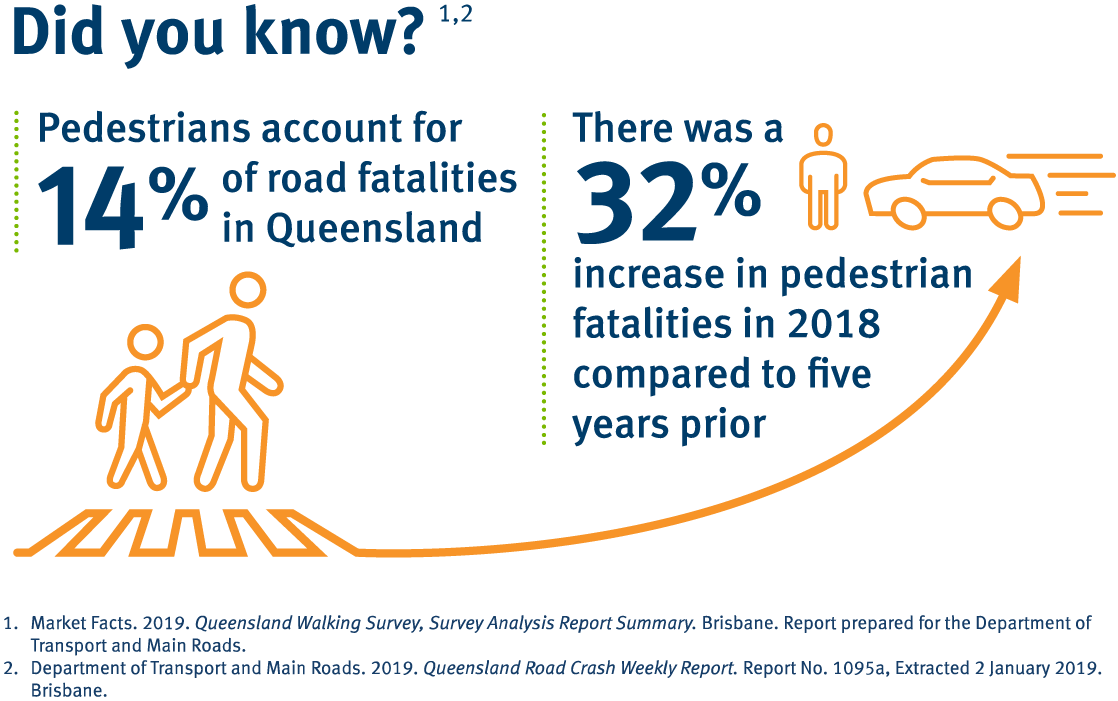
Pedestrians account for 14% of road fatalities in Queensland.
There was a 32% increase in pedestrian fatalities in 2018 compared to 5 years prior.
- PNG version of the Pedestrian road fatalities infographic
- SVG version of the Pedestrian road fatalities infographic
Comfortable walking distance
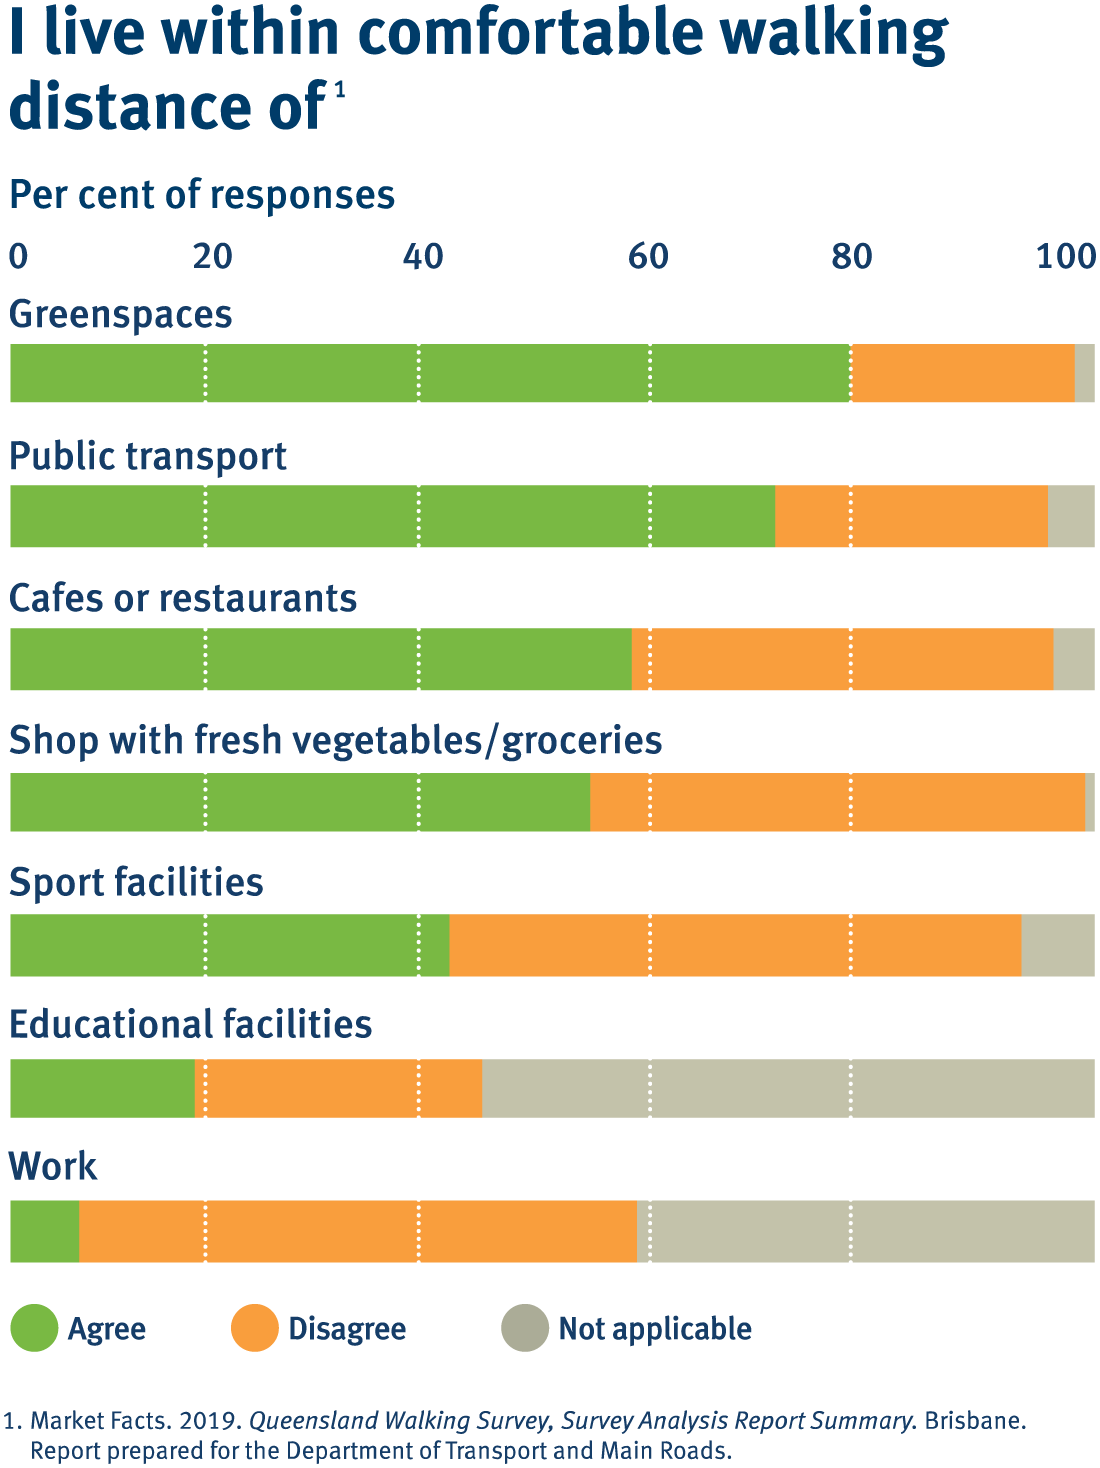
This infographic includes a graph of responses from people on whether they live within comfortable walking distance of facilities such as:
- greenspaces
- public transport
- cafes or restaurants
- shops with fresh vegetables/groceries
- sport facilities
- educational facilities
- work.
- PNG version of the Comfortable walking distance infographic
- SVG version of the Comfortable walking distance infographic
Personal barriers to walking
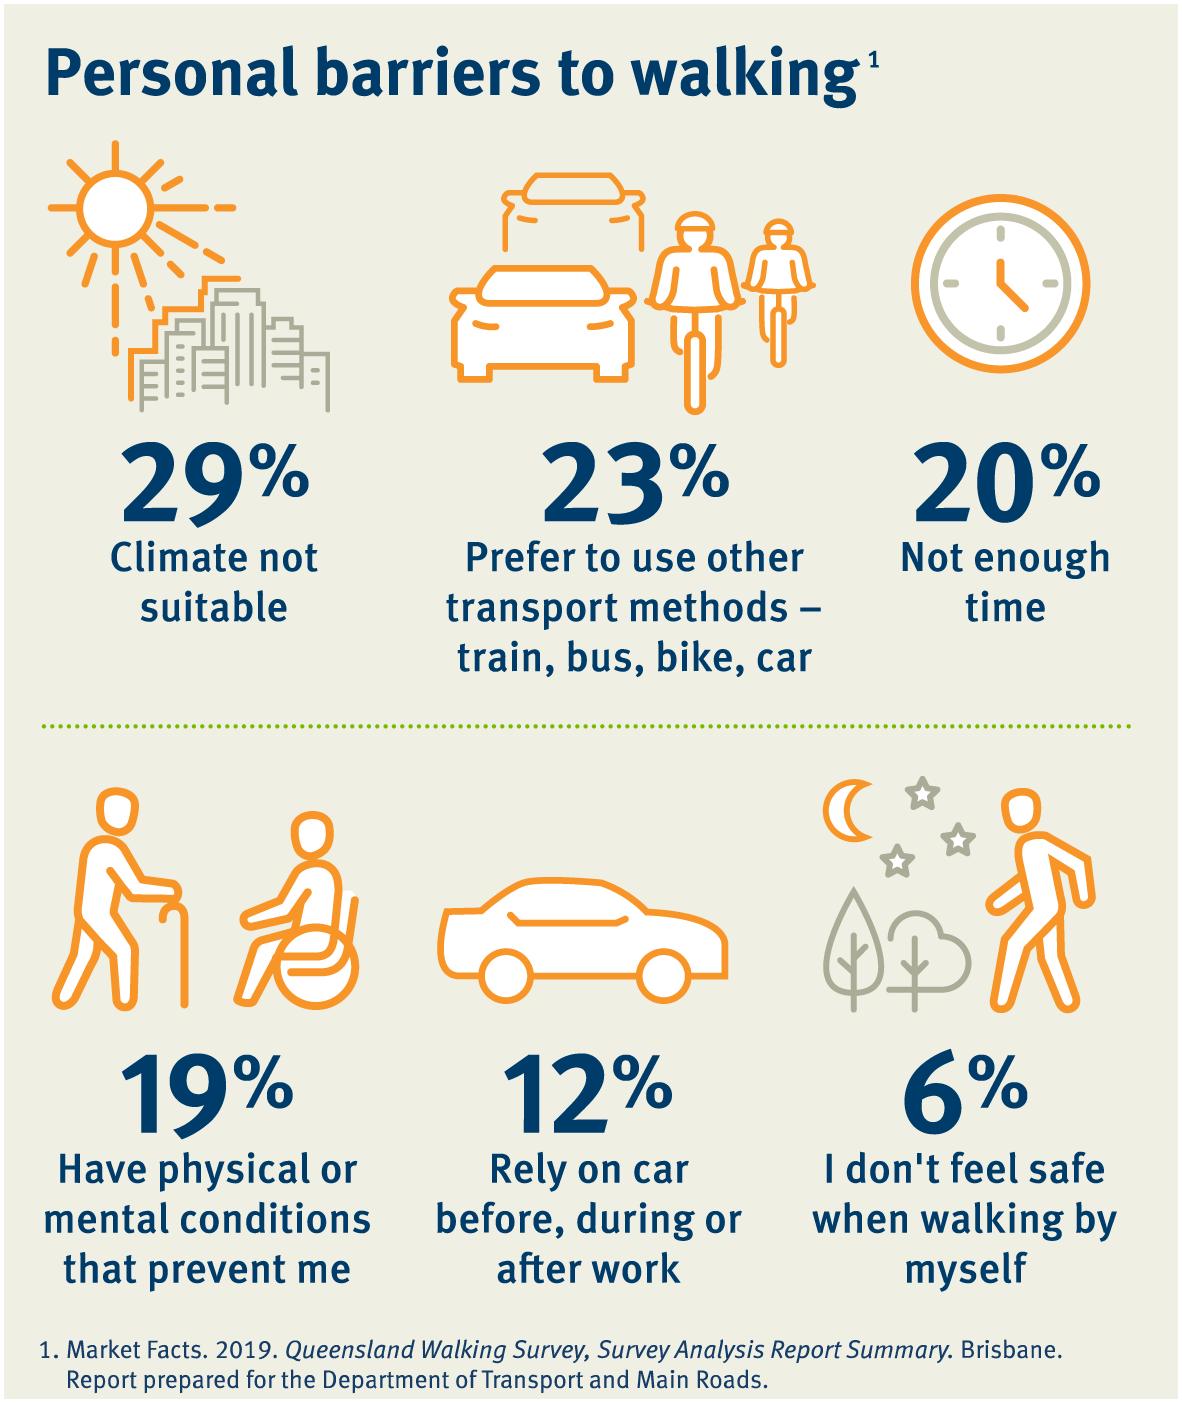
This infographic includes respondents' personal barriers to walking, including:
- climate not suitable (29%)
- prefer to use other transport methods, such as train, bus, bike, car (23%)
- not enough time (20%)
- physical or mental conditions that prevent them from walking (19%)
- relying on their car before, during or after work (12%)
- not feeling safe walking by themselves (6%)
- PNG version of the Personal barriers to walking infograph
- SVG version of the Personal barriers to walking infograph
Proportion of journeys to work by walking
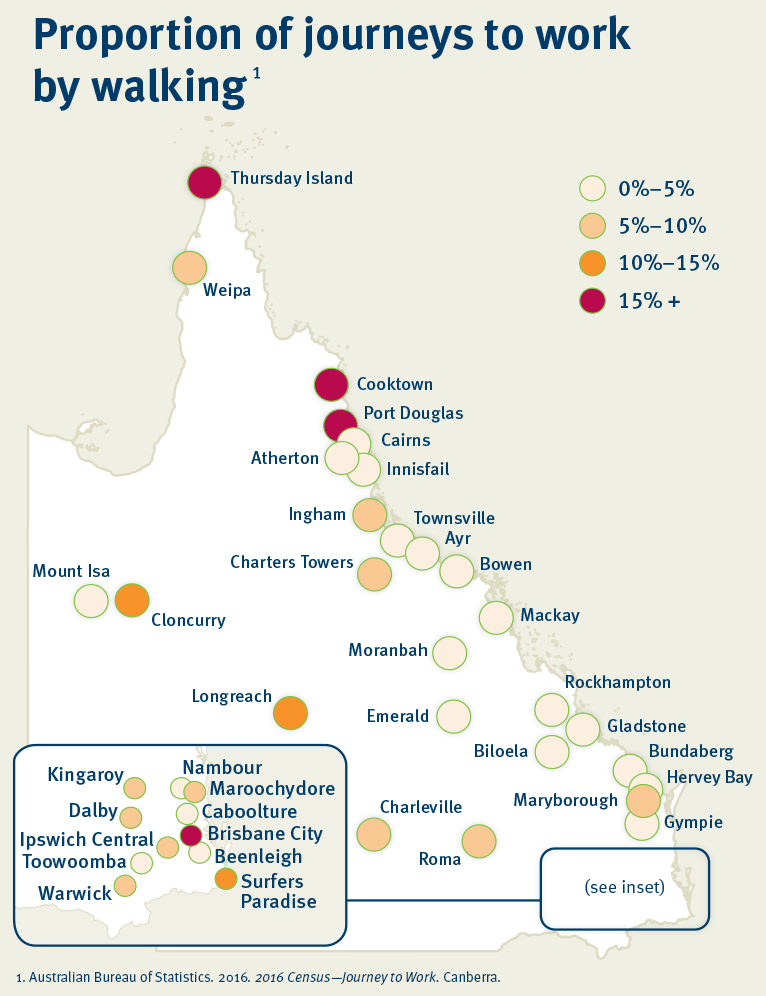
This infographic shows a map of the state of Queensland with the percentage of journeys to work that are done by walking.
Reasons Queenslanders walk
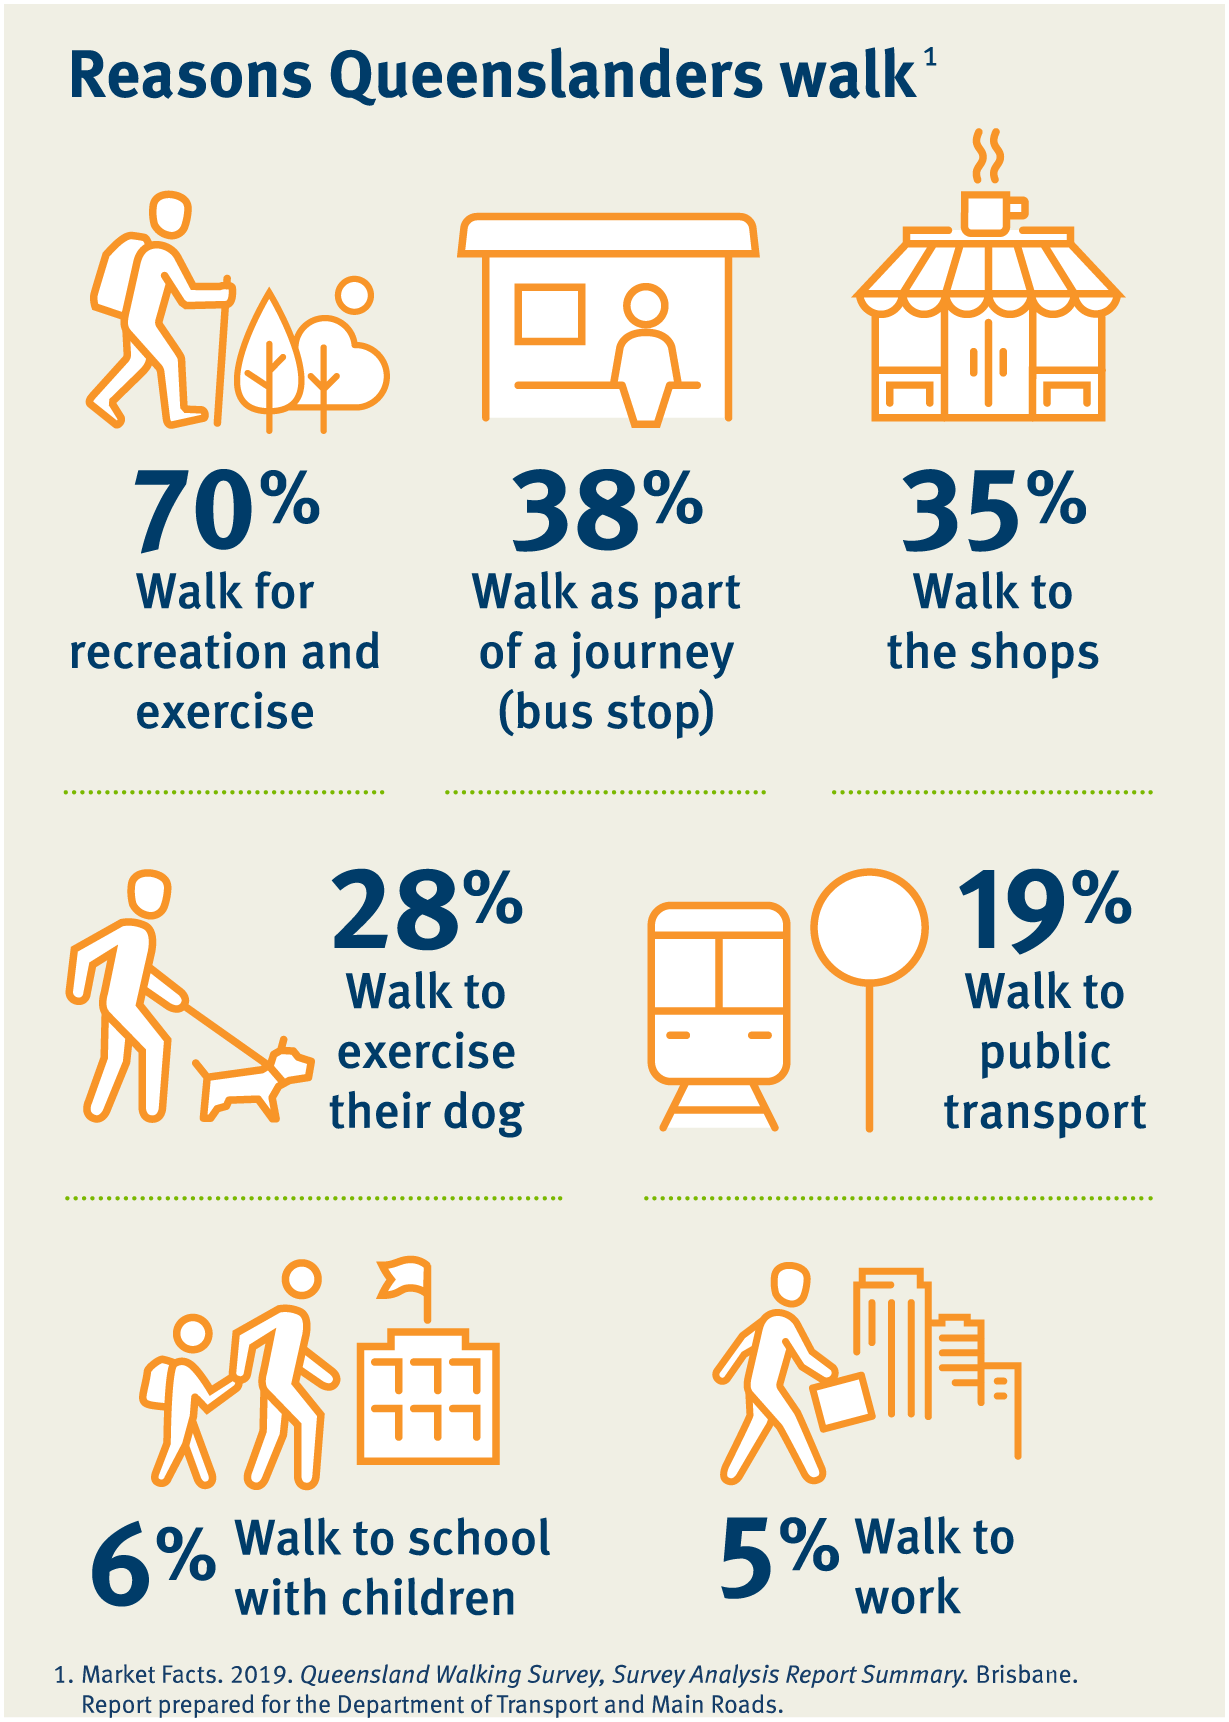
This infograph shows reasons Queenslanders gave for walking, including:
- for recreation and exercise (70%)
- as part of a journey (38%)
- to get to the shops (35%)
- to exercise their dog (28%)
- to get to public transport (19%)
- to walk children to school (6%)
- to walk to work (5%)
- PNG version of the Reasons Queenslanders walk infographic
- SVG version of the Reasons Queenslanders walk infographic
Risk of pedestrian death as a function of vehicle impact speed
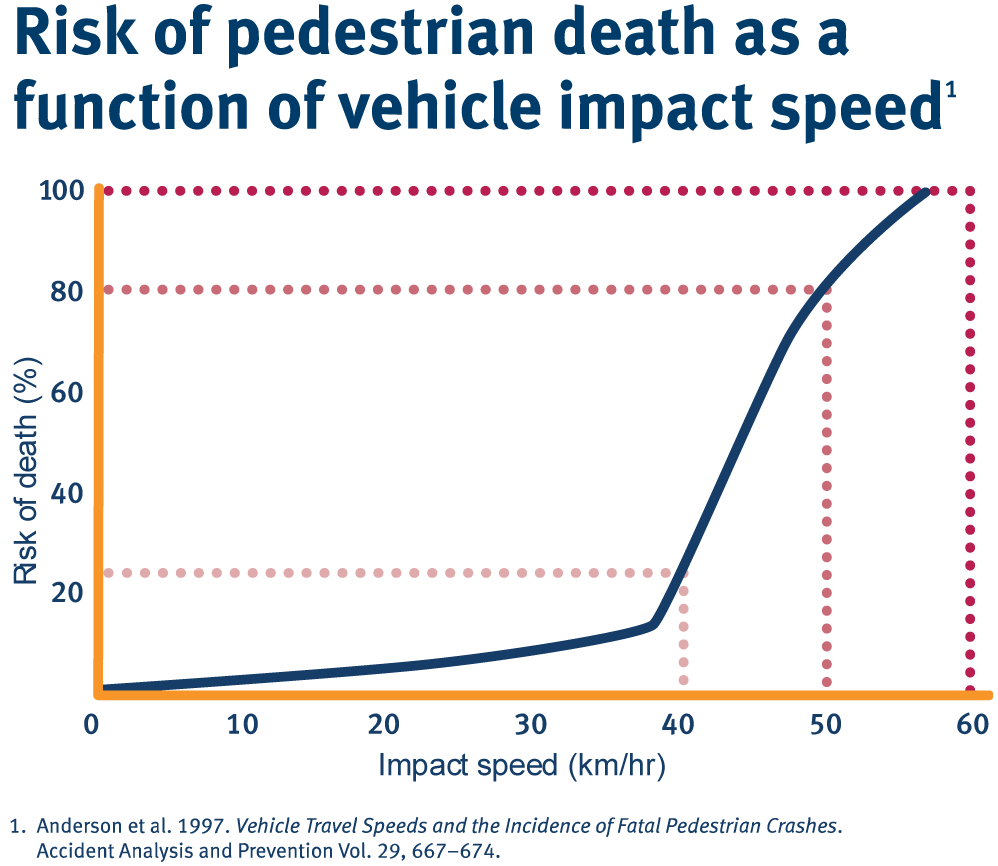
This infographic shows the risk of death as a function of vehicle impact speed. There is a 20% chance of death if the vehicle impacts a pedestrian at 40km/h, 80% if the vehicle is travelling at 50 km/h, and 100% if it's travelling at 60km/h.
- PNG version of the Risk of pedestrian death as a function of vehicle impact speed infographic
- SVG version of the Risk of pedestrian death as a function of vehicle impact speed infographic
Proportion of students (aged 5–18) that walk to school (Greater Brisbane 1975–2017)
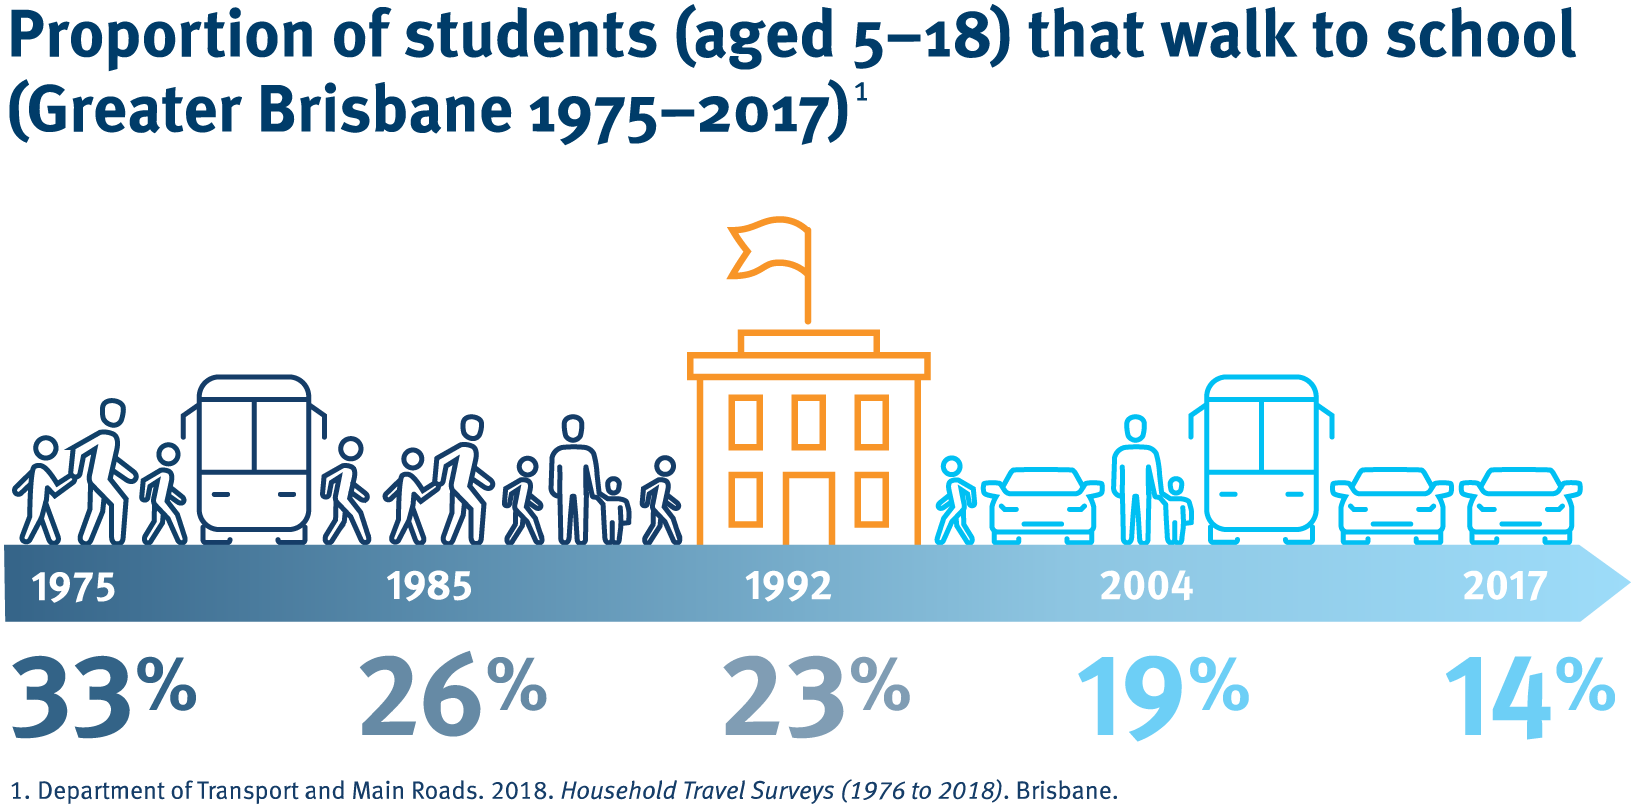
This infographic shows the percentage of students that walk to school in Greater Brisbane. In 1975 33% of students walked, while in 2017 this had reduced to 14%.
- PNG version of the Proportion of students (aged 5–18) that walk to school (Greater Brisbane 1975–2017) infographic
- SVG version of the Proportion of students (aged 5–18) that walk to school (Greater Brisbane 1975–2017) infographic
What motivates Queenslanders to walk?
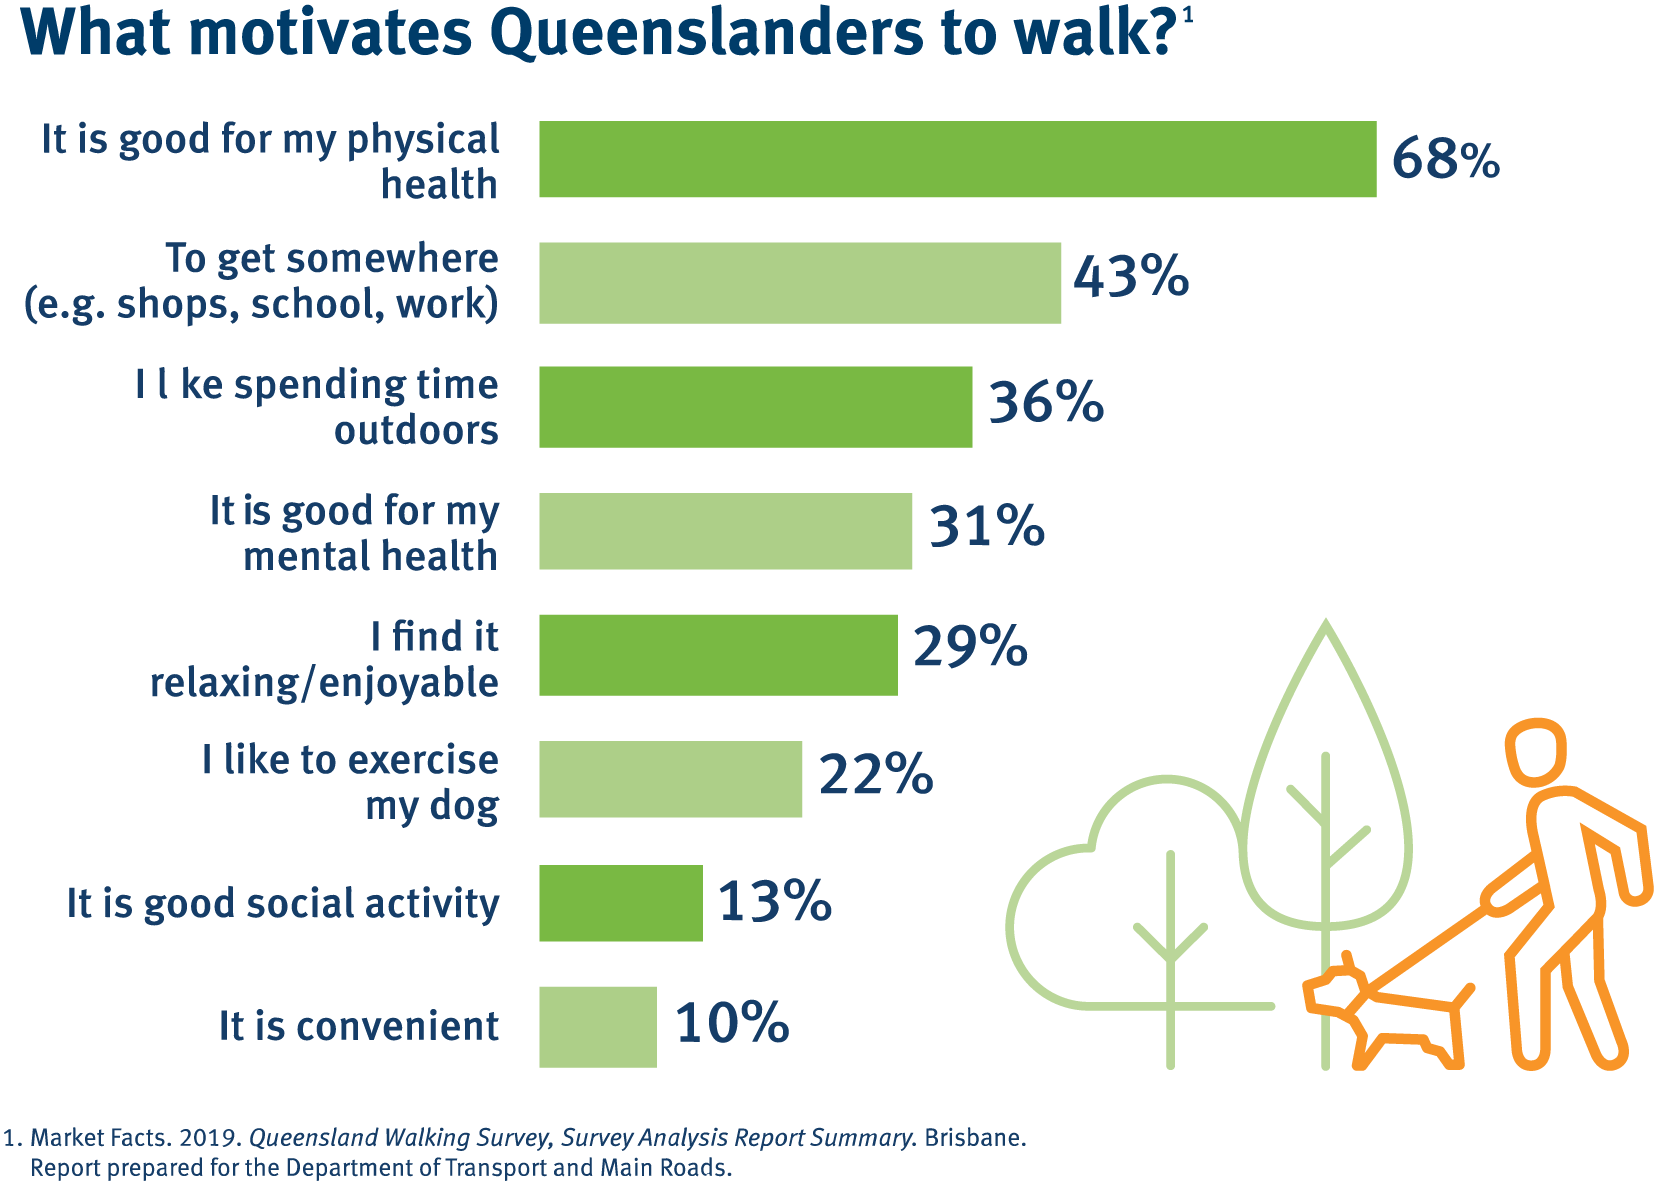
This infographic lists the reasons that Queenslanders are motivated to walk:
- It is good for my physical health (68%)
- To get somewhere (43%)
- I like spending time outdoors (36%)
- It's good for my mental health (31%)
- I find it relaxing/enjoyable (29%)
- I like to exercise my dog (22%)
- It is good social activity (13%)
- It is convenient (10%)
- PNG version of the What motivates Queenslanders to walk? infographic
- SVG version of the What motivates Queenslanders to walk? infographic
What would encourage Queenslanders to walk more?
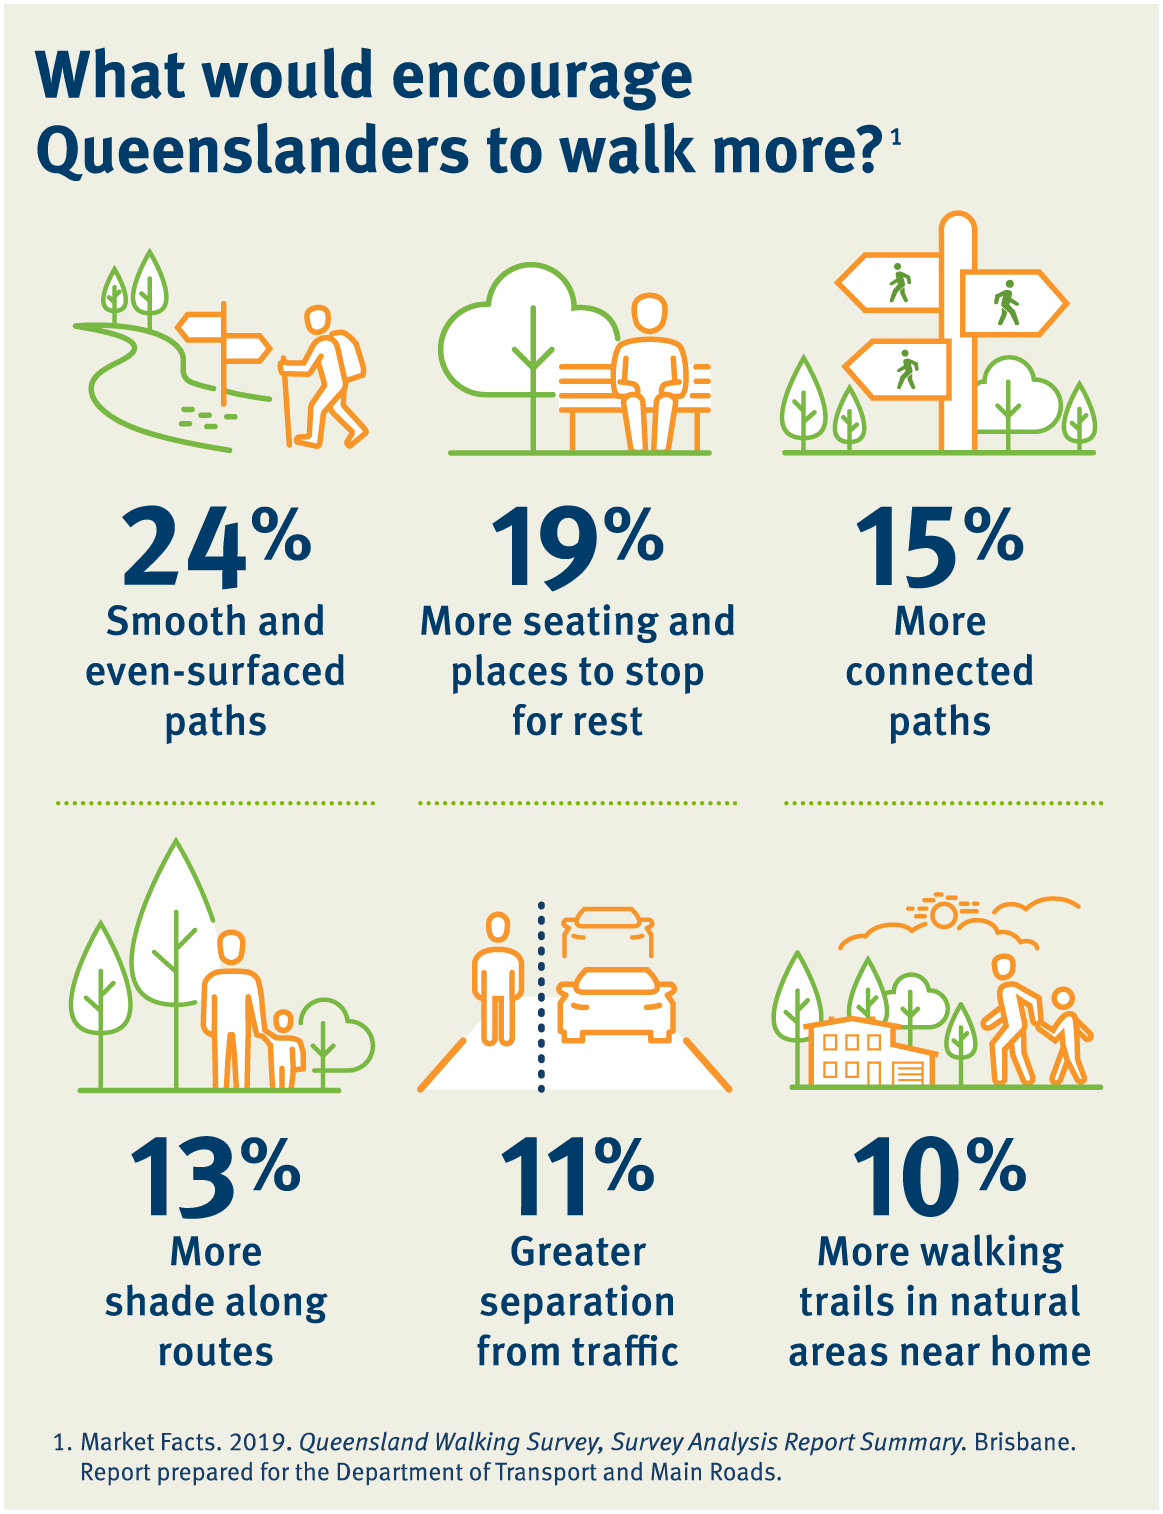
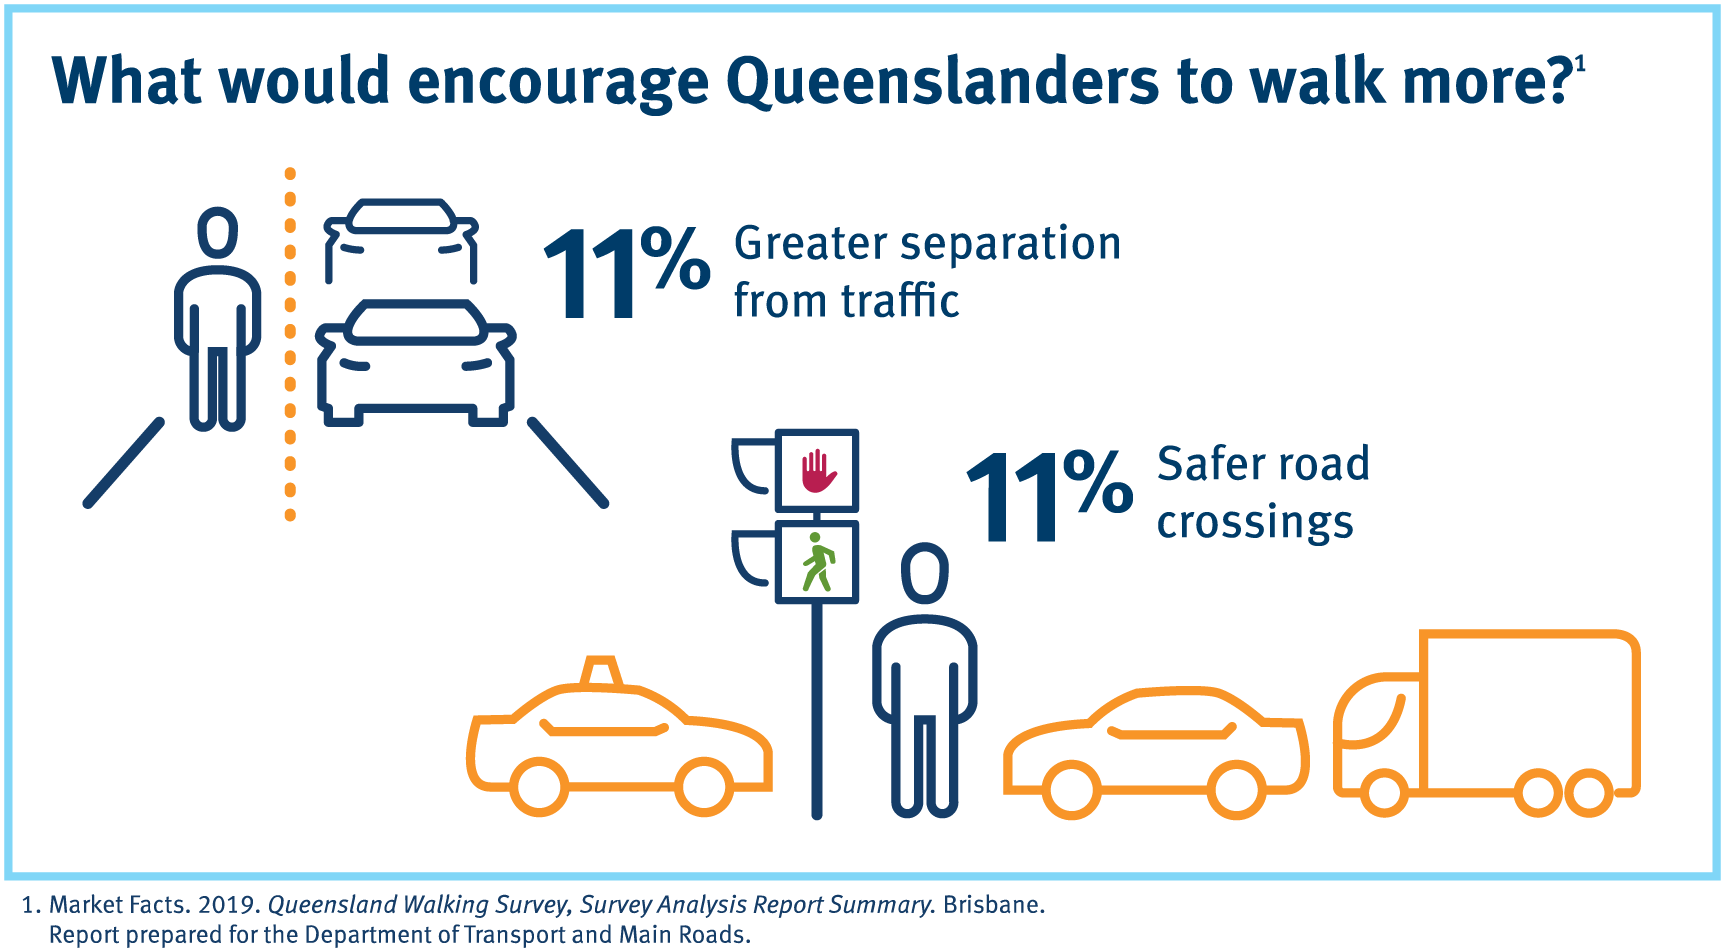
Queenslanders said that the following things would encourage them to walk more:
- smooth and even-surfaced paths (24%)
- more seating and places to stop for rest (19%)
- more connected paths (15%)
- more shade along routes (13%)
- greater separation from traffic (11%)
- safer road crossings (11%)
- more walking trails in natural areas near home (10%)
- PNG version of What would encourage Queenslanders to walk more infographic (part 1)
- PNG version of What would encourage Queenslanders to walk more infographic (part 2)
- SVG version of What would encourage Queenslanders to walk more infographic (part 1)
- SVG version of What would encourage Queenslanders to walk more infographic (part 2)
Videos
The walk I do most often
I would walk more if
Future of walking
What Queenslanders said about the Queensland Walking Summit
- Last updated 18 March 2024