
Cycling investment in Queensland
Queensland's population is expected to continue to grow significantly, so there is no better time to get more people on bikes.
On this page:
- Our investment in cycling
- How we invest in cycling
- Why we invest in cycling
- Active transport economic appraisal tool
- What's next
Our investment in cycling
The Queensland Government is investing in cycling because when people ride, it contributes to:
- making our transport system more sustainable
- maintaining a healthy environment and more active lifestyles
- the vitality of our cities, towns and neighbourhoods
- reducing congestion.
By delivering well-planned, connected cycling infrastructure, we will help make riding a bike in Queensland safer, enjoyable and a more attractive transport choice.
This video shows the growth in people riding, along with the investment in off-road cycling infrastructure, within inner Brisbane between 1986 and 2016.
How we invest in cycling
The Queensland Cycling Strategy 2017-2027 sets out the Queensland Government's vision for more cycling, more often in Queensland.
We invest in cycling through the:
- Cycling Infrastructure Policy
- Active Transport Investment Program.
Cycling Infrastructure Policy
The Cycling Infrastructure Policy requires the Department of Transport and Main Roads to progressively plan, design, construct, maintain and operate the state-controlled transport network, on the basis that bicycle riders will use the network.
Under the policy, projects funded by the department on principal cycle routes will explicitly provide cycling infrastructure within the project's scope. Projects not located on principal cycle routes will make implicit provision.
This policy ensures we plan, design and construct fit-for-purpose cycling infrastructure and facilities, that deliver value for money and realisable benefits.
Active Transport Investment Program
Funded as part of the Queensland Transport and Roads Investment Program (QTRIP), the Active Transport Investment Program supports development of bike riding infrastructure, planning and programs, as well as walking initiatives, across Queensland.
The program promotes and supports collaboration between state and local governments to achieve a 'one network' outcome for people who ride bikes. It supports the delivery of the highest priority routes of the Queensland Principal Cycle Network through the:
- Cycling Works subprogram—provides funding to districts to deliver state-controlled routes
- Active Transport Grants Program—provides grant funding to local governments to deliver their routes.
Find out more about the current and planned active transport infrastructure investment provided by the Queensland Transport and Roads Investment Program.
Why we invest in cycling
Since 2006, the Active Transport Investment Program has delivered high-quality infrastructure with strongly positive benefit-cost ratios on projects, such as the Veloway One (Stage C) and the Cairns Northern Cycleway.

Economic modelling helps us understand which future investments will produce the largest returns for the community.
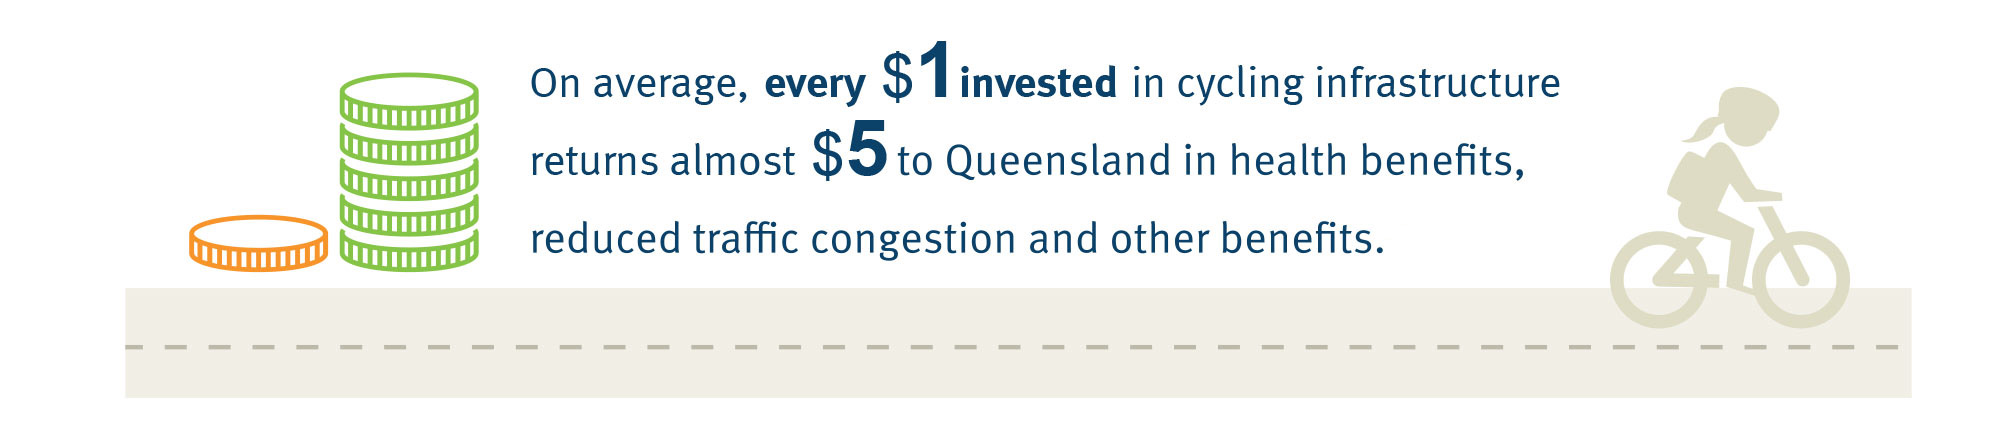
Modelling conducted in 2016-17 showed that Queensland could expect almost $5 in economic benefits for every $1 invested in cycling infrastructure, creating a strong case for continued investment in cycling.
The results also found:
- health benefits far outweigh other benefits—calculated at $0.67 per kilometre ridden
- 'journey ambience' related to separated cycling facilities (as opposed to on-road cycle lanes) is important—calculated at $0.14 per kilometre
- bicycle injury costs are a disadvantage, however the overall benefits outweigh this by 4:1
- a 40% reduction in bicycle accidents could be achieved by separating cycling infrastructure from motor vehicle traffic
- completed highest priority routes generated economic benefits—approximately $721 million over the appraisal period
- Net Present Values increase with level of investment
- the net economic benefit is equivalent to $77 million a year (in present value terms) for 30 years.
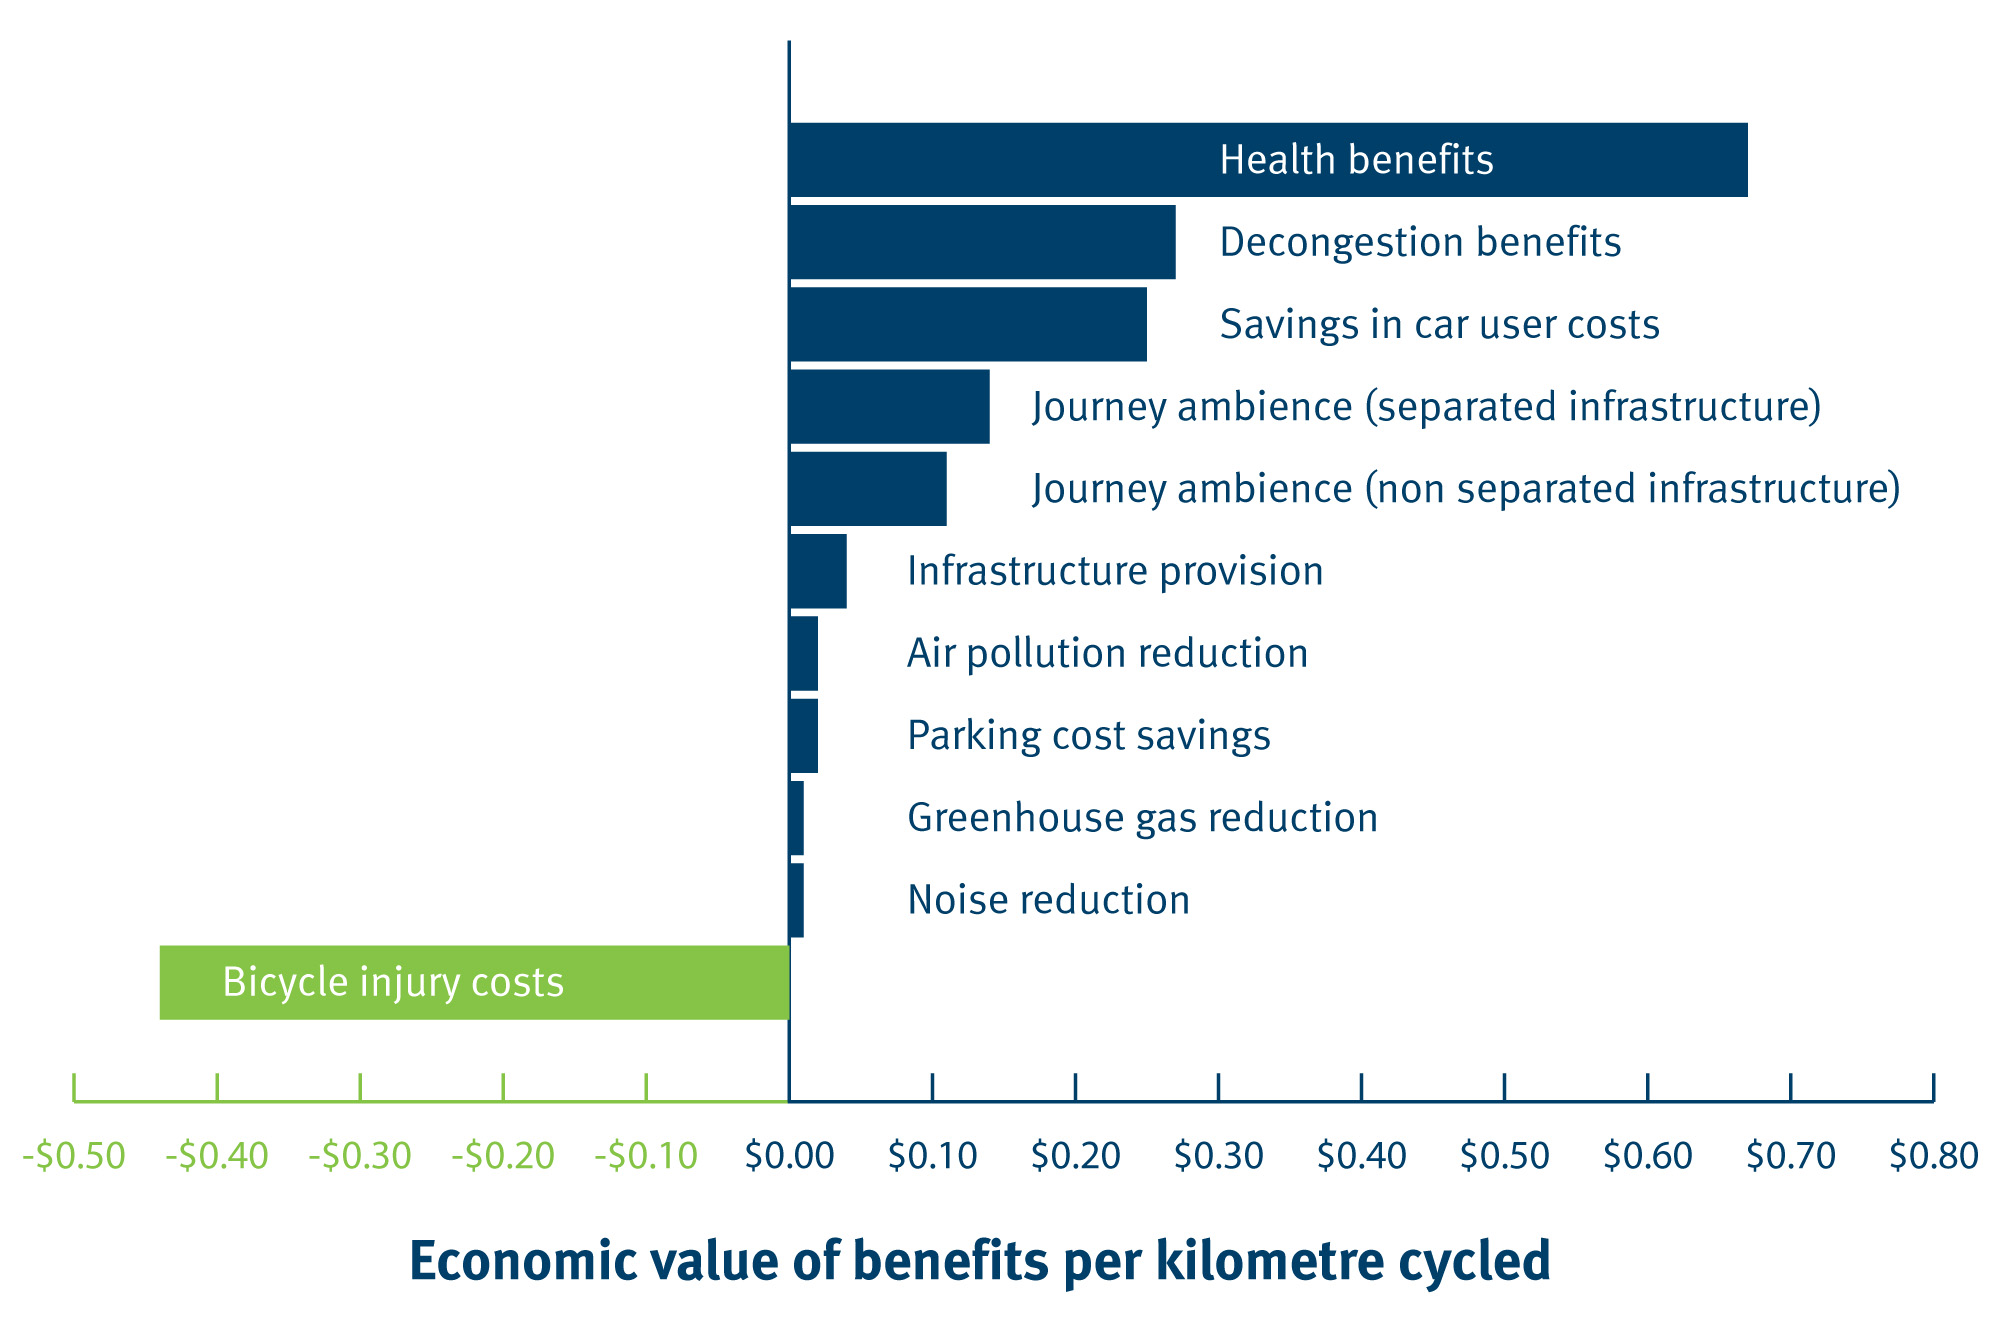
You can access this infographic information in text form.
There are also other benefits of implementing a cycle network. For example, journey ambience relates to the enjoyment cyclists get from using safer facilities, such as cycle facilities separated from motor vehicles.
Active transport economic appraisal tool
We have developed an economic appraisal tool for estimating the economic costs and benefits of investment in walking and cycling infrastructure projects in Queensland.
What's next
It is important that current and future bike riders are supported by good planning and investment in safe, connected, separated cycling infrastructure.
Our investments will continue to deliver the identified highest priority routes in the Queensland Principal Cycle Network, to make bike riding in Queensland safer, better connected and a more attractive transport choice.
The Queensland State of Cycling Report is updated and published every 2 years, allowing us to monitor and report on the Active Transport Investment Program and track our progress.
- Last updated
- 26 June 2026